目次
(4)モデル学習(Keras)
Keras2でMNIST目次
Kerasプログラミングの全体図
- (4)モデル学習(Keras) ⇐ いまココ
基本的に以下をコピペするだけです。
#4 モデル学習(Keras)
history = model.fit(x_train, y_train,
                    batch_size=batch_size, epochs=epochs,
                    verbose=1, validation_data=(x_test, y_test))
開発環境
Windows 8.1
Anaconda
Python 3.5
Tensorflow 1.4
Keras 2.0.9
Keras2.0のインストール方法はwindowsにkeras2.0をインストールをご覧下さい。
このページは、(3)モデル設定(Keras)の続きであり、今回は、モデルの学習を行っていきます。
手順
0. 前回終了時の画面
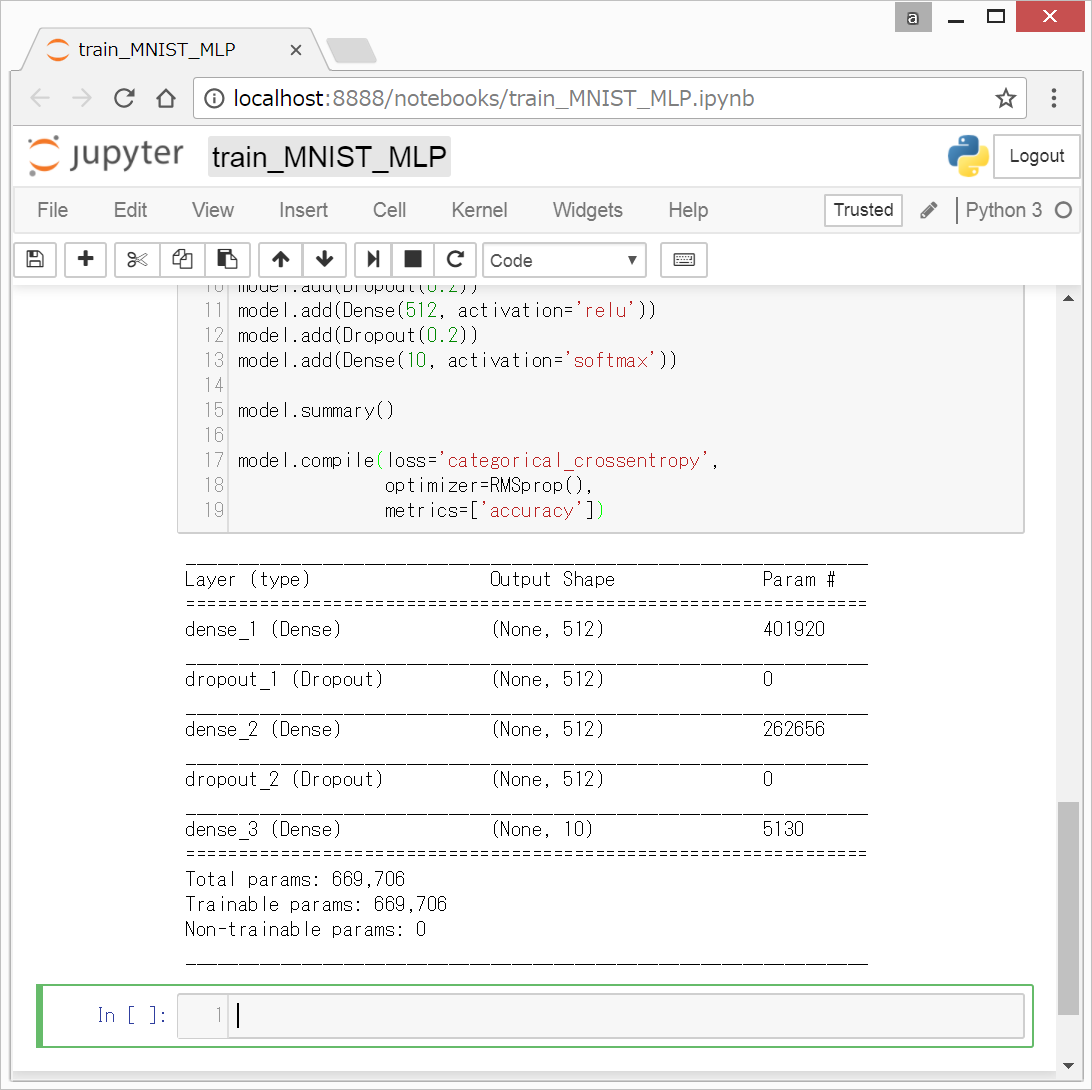
(3)モデル設定(Keras)終了時の、以下のような状態から始めます。
1. モデルの学習
以下のコードを入力して、Shift + Enterを押します。
#4 モデル学習(Keras)
history = model.fit(x_train, y_train,
                    batch_size=batch_size, epochs=epochs,
                    verbose=1, validation_data=(x_test, y_test))
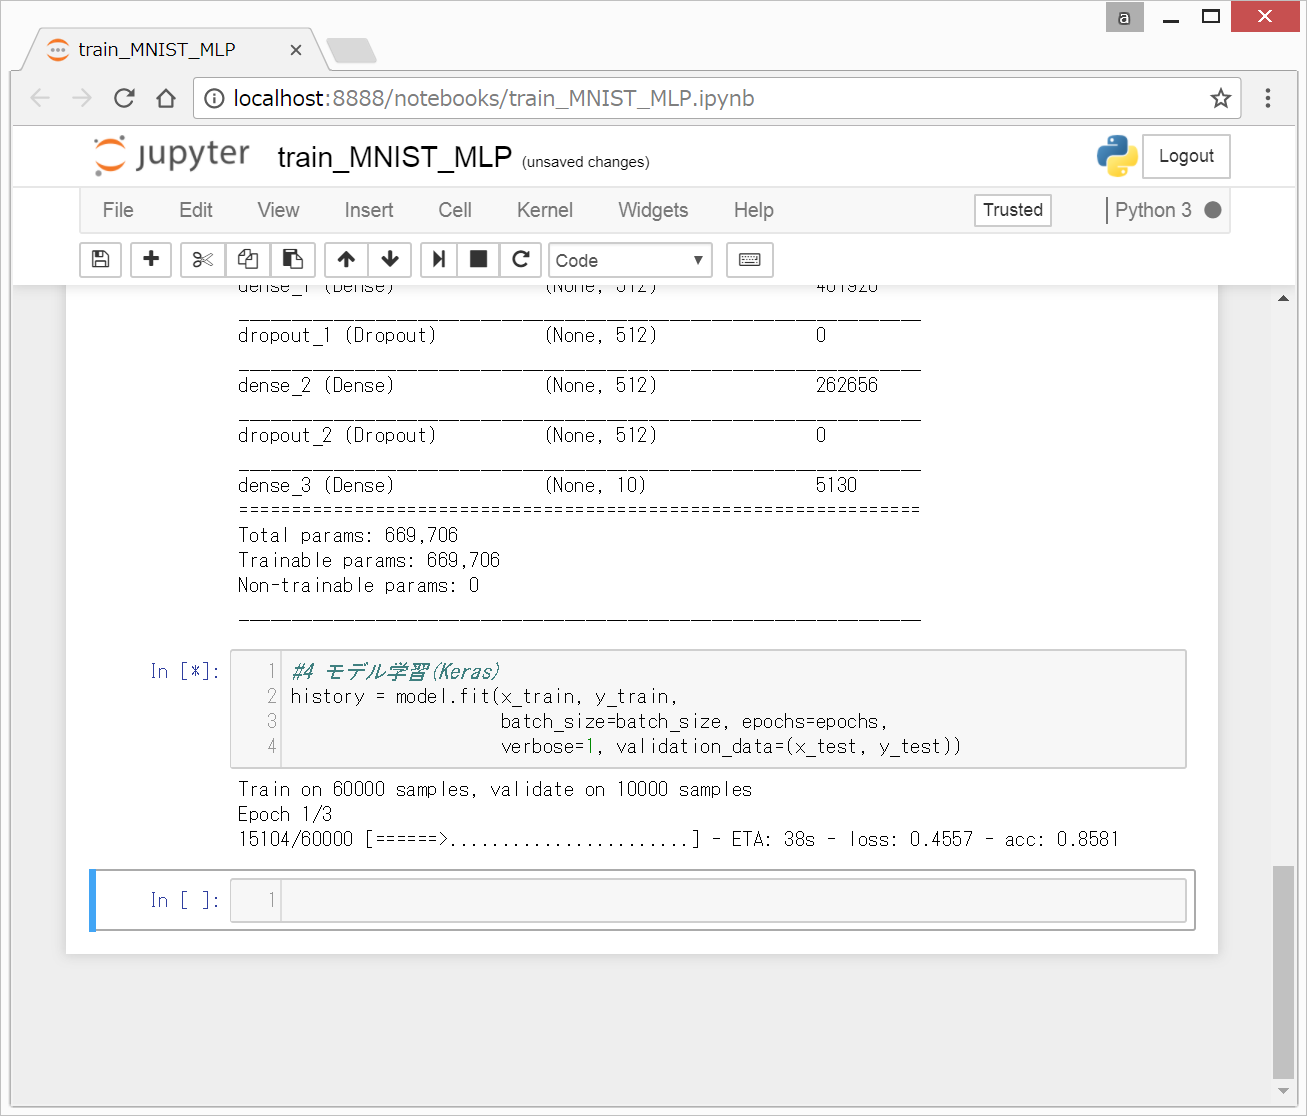
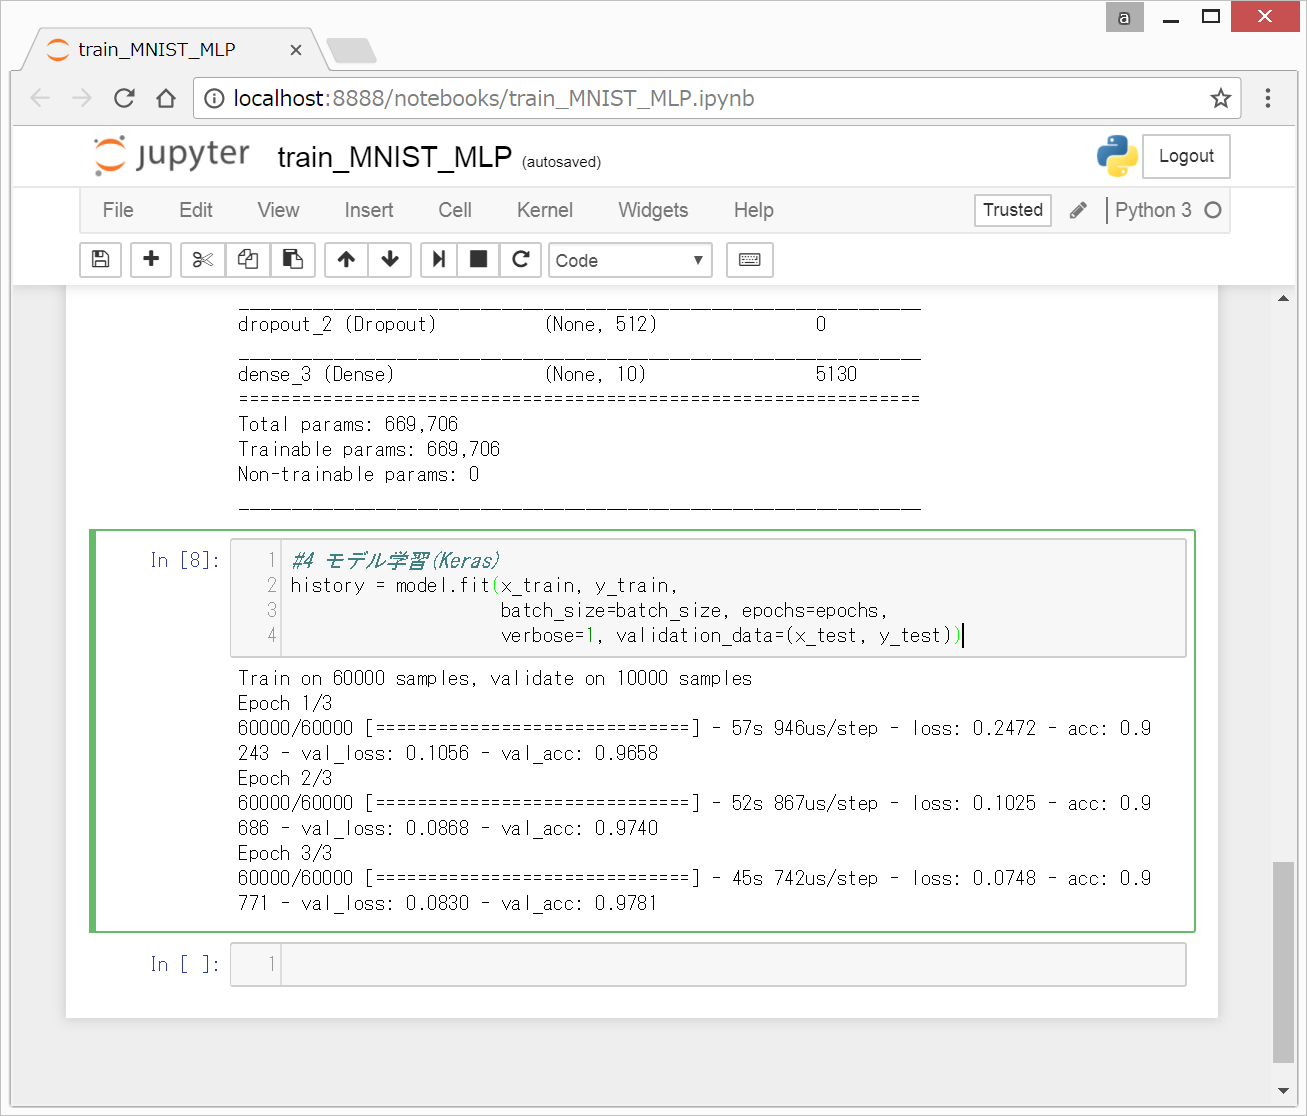
以下のような画面になります。
3分くらい待つと、学習が終了します。
model.fit()関数により、モデルの学習を実行しています。
引数については、KerasのDocumentationそのままとなりますが、以下に記載します。
x: 入力データ,Numpy 配列,あるいは Numpy 配列のリスト (モデルに複数の入力がある場合)
y: ラベル,Numpy 配列.
batch_size: 整数.設定したサンプル数ごとに勾配の更新を行います。今回は、(3)モデル設定(Keras)のところで、batch_size = 128と設定していましたので、128が用いられています。
epochs: 整数で,モデルを訓練するエポック数。今回は、(3)モデル設定(Keras)のところで、epochs = 3と設定していましたので、3回学習が行われています。
verbose: 0とすると標準出力にログを出力しません. 1の場合はログをプログレスバーで標準出力,2 の場合はエポックごとに1行のログを出力します
validation_data=(x_test, y_test): ホールドアウト検証用データとして使うデータのタプル (x_val, y_val) か (x_val, y_val, val_sample_weights)。設定すると validation_split を無視します。
KerasでのModel学習の手順は上記でおしまいです。
初めての方は、次は、(5)結果の出力(Keras)に進んでください。
(参考)
Keras チュートリアル
sasayabaku
2017年08月16日に更新
https://qiita.com/sasayabaku/items/64a01363bcd5c44feb0b
kerasのSequentialモデルのfitメソッドについて
https://keras.io/ja/models/sequential/
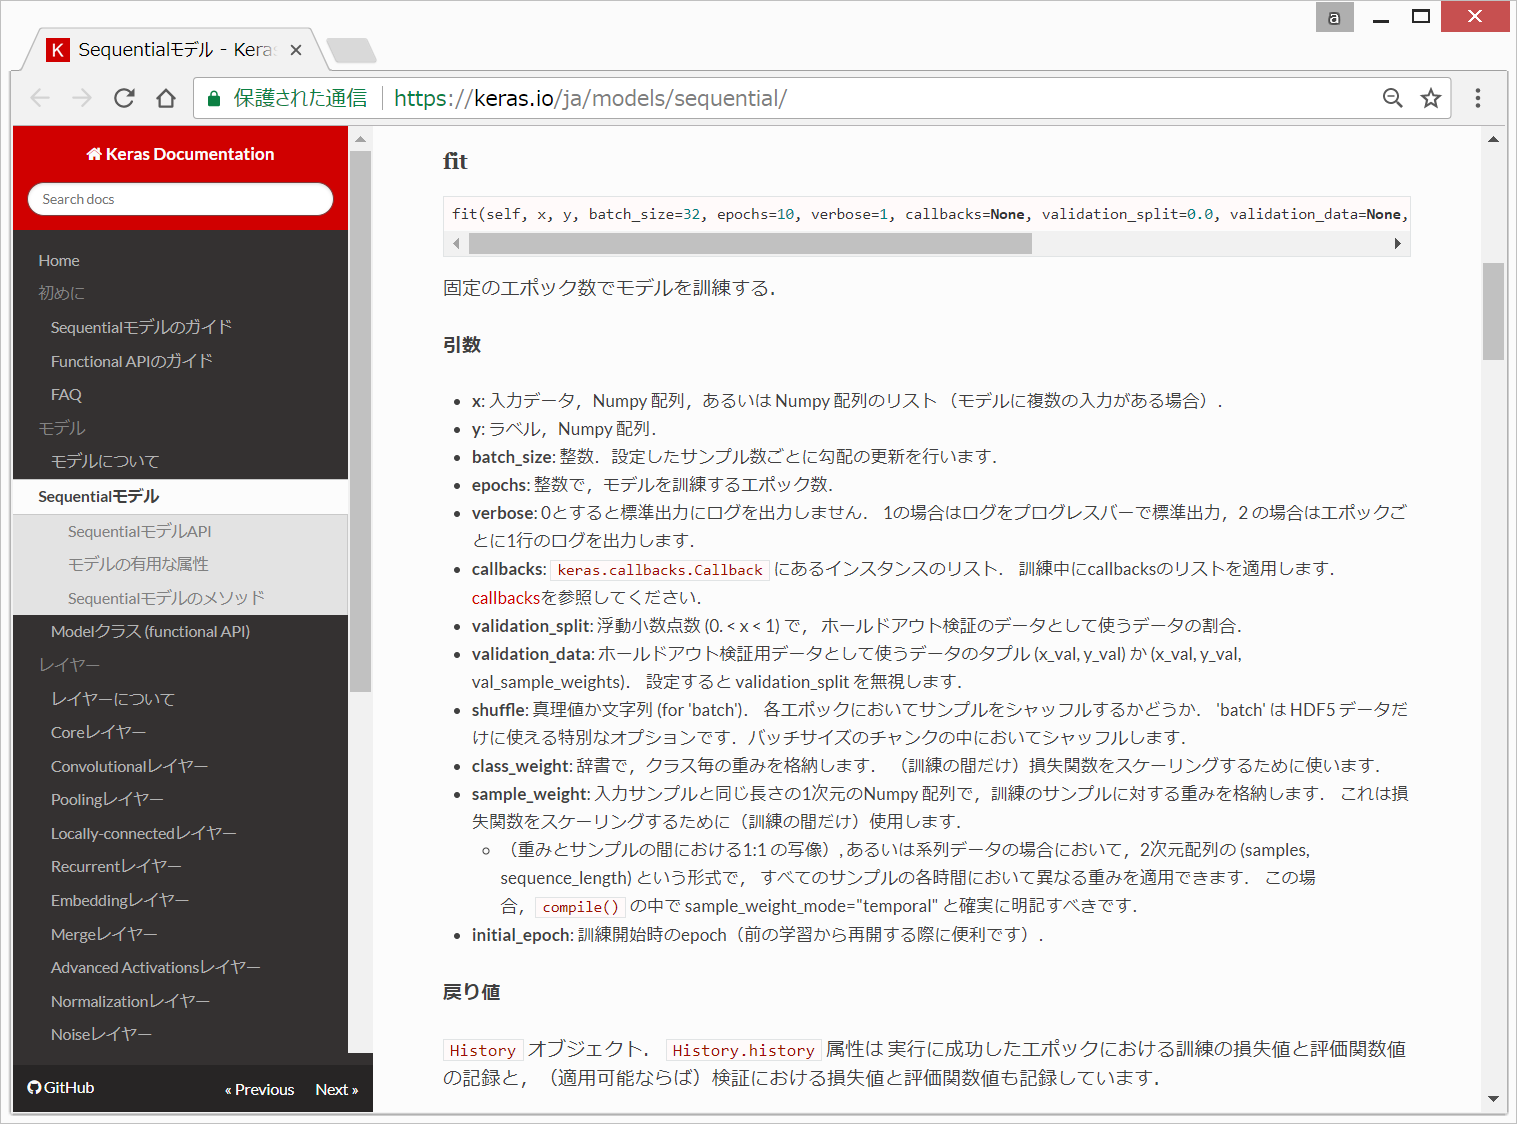
fit()関数は、固定のエポック数でモデルを訓練します。
戻り値は、History オブジェクト。History.history 属性は、実行に成功したエポックにおける訓練の損失値と評価関数値の記録と,(適用可能ならば)検証における損失値と評価関数値も記録しています。
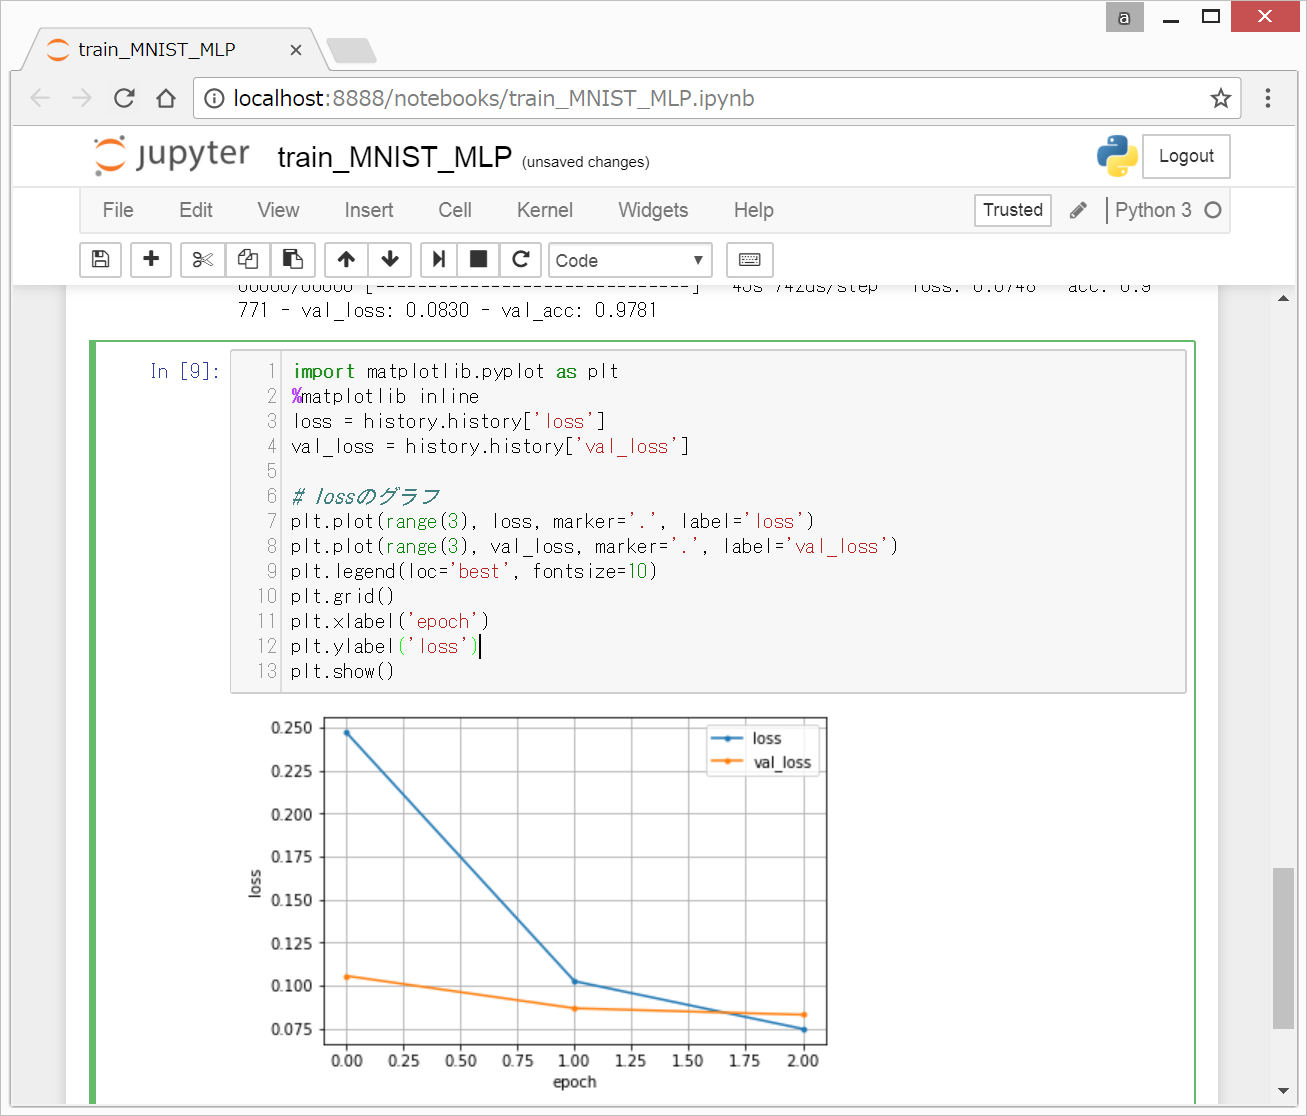
model.fit()の返り値を出力を変数に格納すると学習過程のパラメータの推移をプロットできます。
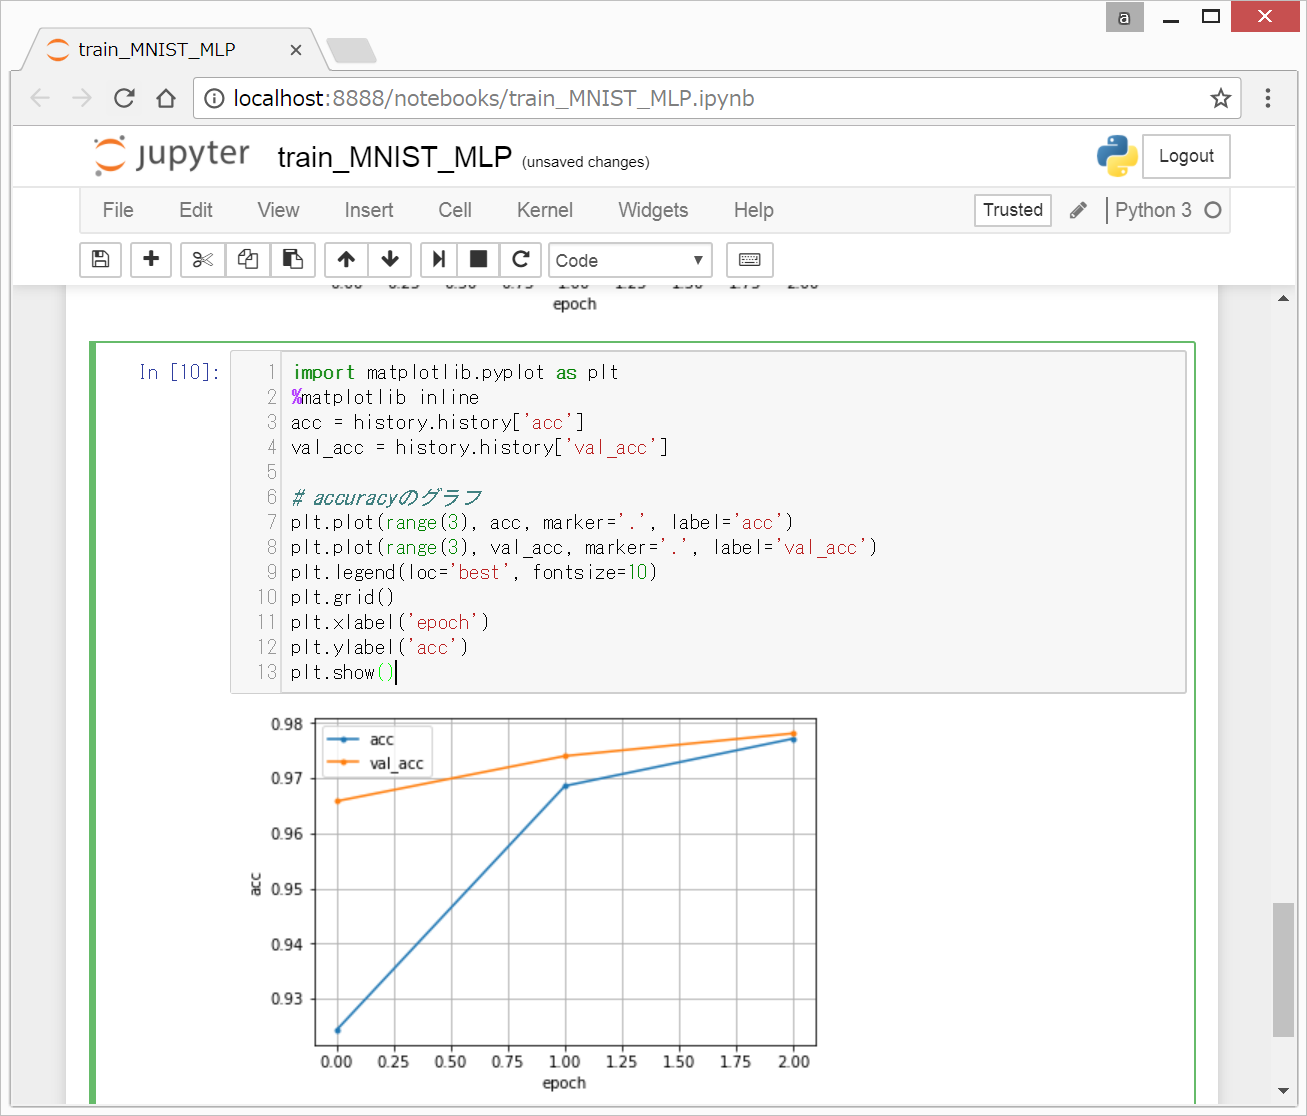
上記の例では、Historyに格納しているので、以下のようなコードで、lossやaccuracyのグラフを出力することができます。
import matplotlib.pyplot as plt
%matplotlib inline
loss = history.history['loss']
val_loss = history.history['val_loss']

# lossのグラフ
plt.plot(range(3), loss, marker='.', label='loss')
plt.plot(range(3), val_loss, marker='.', label='val_loss')
plt.legend(loc='best', fontsize=10)
plt.grid()
plt.xlabel('epoch')
plt.ylabel('loss')
plt.show()
import matplotlib.pyplot as plt
%matplotlib inline
acc = history.history['acc']
val_acc = history.history['val_acc']

# accuracyのグラフ
plt.plot(range(3), acc, marker='.', label='acc')
plt.plot(range(3), val_acc, marker='.', label='val_acc')
plt.legend(loc='best', fontsize=10)
plt.grid()
plt.xlabel('epoch')
plt.ylabel('acc')
plt.show()
Optimizerについて
optimizer(最適化)について
https://keras.io/ja/optimizers/
参考文献
初めてKerasプログラミングをやるときの超おすすめ本。
<html>
<iframe style=“width:120px;height:240px;” marginwidth=“0” marginheight=“0” scrolling=“no” frameborder=“0” src=“rcm-fe.amazon-adsystem.com/e/cm?lt1=_blank&bc1=000000&IS2=1&bg1=FFFFFF&fc1=000000&lc1=0000FF&t=twosquirrel-22&o=9&p=8&l=as4&m=amazon&f=ifr&ref=as_ss_li_til&asins=4873117585&linkId=13a7db2c19cc5f40d6ab48906de8abd1”></iframe>
<iframe style=“width:120px;height:240px;” marginwidth=“0” marginheight=“0” scrolling=“no” frameborder=“0” src=“rcm-fe.amazon-adsystem.com/e/cm?lt1=_blank&bc1=000000&IS2=1&bg1=FFFFFF&fc1=000000&lc1=0000FF&t=twosquirrel-22&o=9&p=8&l=as4&m=amazon&f=ifr&ref=as_ss_li_til&asins=4839962510&linkId=d722909965b5eab4196d370757843f6f”></iframe>
</html>
