目次
06.Google Colaboratoryで時系列データで折れ線グラフを描画
前回の05.Google Colaboratoryで自前データでRで統計では、GoogleColaboratory上で、自作データをアップロードしてRプログラミングを行う方法を紹介しました。
今回は、自作データのうち、『時系列データ』をアップロードして、グラフを描画し、対応のあるt検定を行ってみたいと思います。
Rで折れ線グラフ 過去のリンク
https://i-doctor.sakura.ne.jp/font/?p=44413
dplyr(tidyverse)でsummarise()関数で標準偏差sdを計算するとNAになってしまうときは平均meanの名前の付け方に注意
2020年8月15日
https://i-doctor.sakura.ne.jp/font/?p=21579
ggplot2で折れ線グラフ(1)
2017年12月12日
https://i-doctor.sakura.ne.jp/font/?p=21594
ggplot2で折れ線グラフ(2)
2017年12月12日
ggplot2で折れ線グラフ(factorでもgroup=1で折れ線グラフを描ける)
https://gist.github.com/adash333/0f3f92e0d1676d27a5985c57a0eff1e6
ソースコード
(1)単一の折れ線グラフ
https://colab.research.google.com/drive/1LH8RInDrx0XDS3tivf8coUHaEjG9z15t
https://gist.github.com/adash333/6ebcbb98ebc064ff94c8475d7833bd98
(2)200726_ggplot-line-chart_001.ipynb
https://colab.research.google.com/drive/1SZTh9i62LHZ9qShJKi6CjX3qnMAwZ1qU
https://gist.github.com/adash333/af401dc1aca27c9dad9a37ccfd076beb
(3)
https://colab.research.google.com/drive/1hsdpM_FlUAIK8KzZJDUaUetrRnEons3U?hl=ja
(Colaboratoryでは、なぜか、packageのインストールがうまくいかない。また、stat_summary関数の一部がうまく動かない)
https://adash333.github.io/ggplot2-example/191016_ggplot-bar.html
4
https://gist.github.com/adash333/fd7e673debefa7547895f05d3b50c04f
開発環境
Windows10 Pro (1803) (OSは何でもよいです)
Chrome
Googleアカウント
GoogleDriveで『Text Editor for Drive』を利用(→方法はこちらをご覧ください。)
今回使用したRパッケージ
tidyverse
readxl
自前データの用意
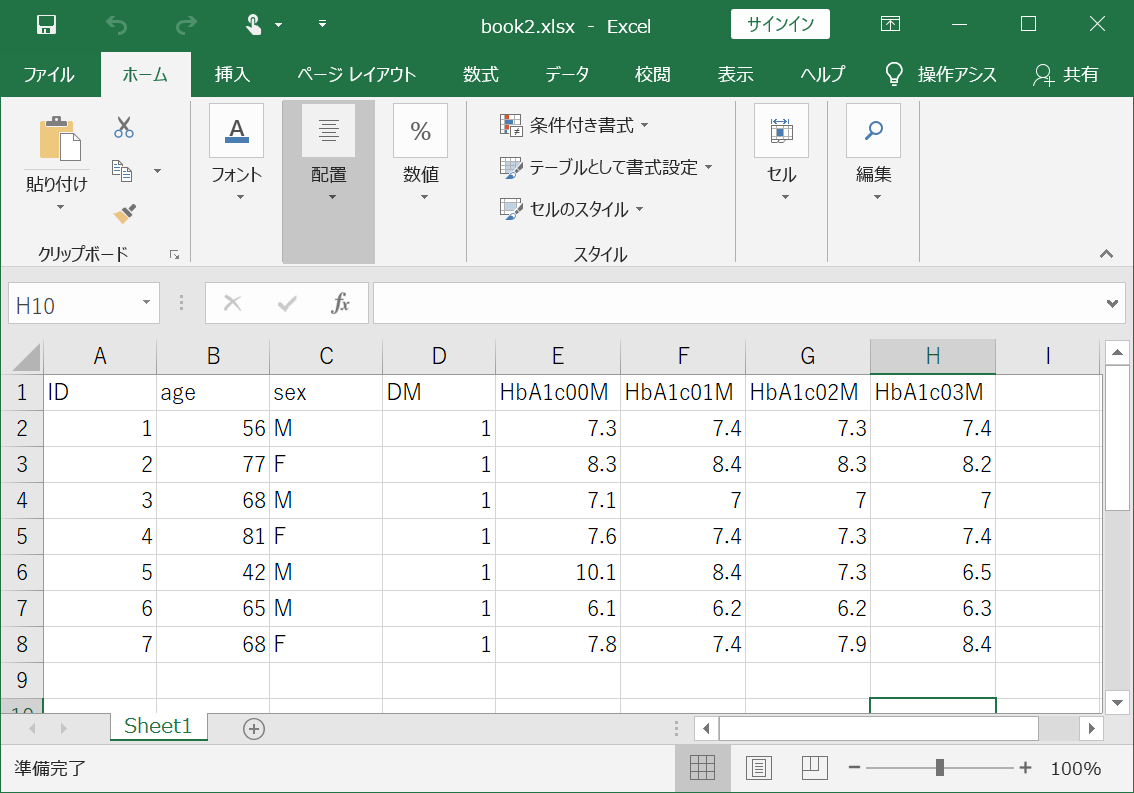
今回、自前のデータとして、以下のエクセルファイルを用いてみます。
book2.xlsx (←クリックでダウンロードできます。)
糖尿病DMの7症例の3ヶ月間のHbA1c[%]の推移のデータです。
| ID | age | sex | DM | HbA1c00M | HbA1c01M | HbA1c02M | HbA1c03M |
|---|---|---|---|---|---|---|---|
| 00001 | 56 | M | 1 | 7.3 | 7.4 | 7.3 | 7.4 |
| 00002 | 77 | F | 1 | 8.3 | 8.4 | 8.3 | 8.2 |
| 00003 | 68 | M | 1 | 7.1 | 7.0 | 7.0 | 7.0 |
| 00004 | 81 | F | 1 | 7.6 | 7.4 | 7.3 | 7.4 |
| 00005 | 42 | M | 1 | 10.1 | 8.4 | 7.3 | 6.5 |
| 00006 | 65 | M | 1 | 6.1 | 6.2 | 6.2 | 6.3 |
| 00007 | 68 | F | 1 | 7.8 | 7.4 | 7.9 | 8.4 |
Rで統計する際の自前データの記載方法については、03.Excelでcsv形式でデータを保存をご覧頂けましたら幸いです。半角英数字とピリオドのみを用いて記載していただくのがお勧めです。なお、欠損データは半角英数字の大文字で『NA』と記載してください。
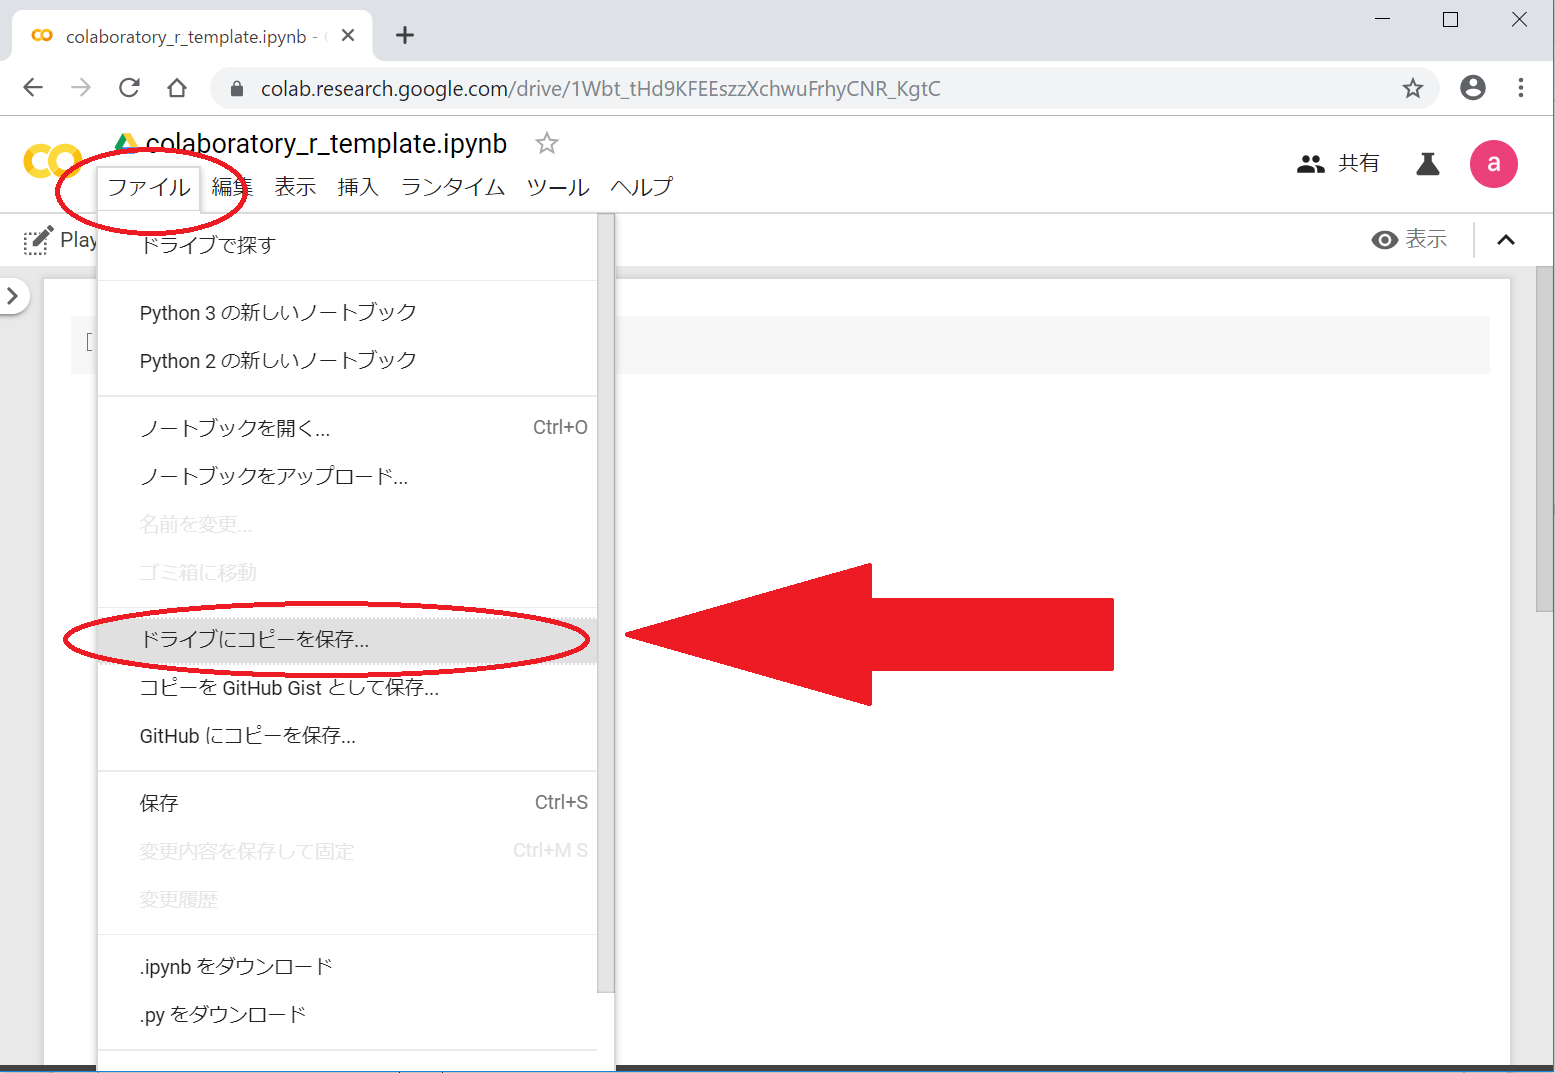
Google ColaboratoryのR用テンプレートをコピーして名前をつけて保存
以下のテンプレートへ行き、Googleログインして、『ファイル』>『ドライブにコピーを保存』を順にクリックすると、自分のipynbファイルとして、そのままRを利用することができます。
https://colab.research.google.com/drive/1Wbt_tHd9KFEEszzXchwuFrhyCNR_KgtC
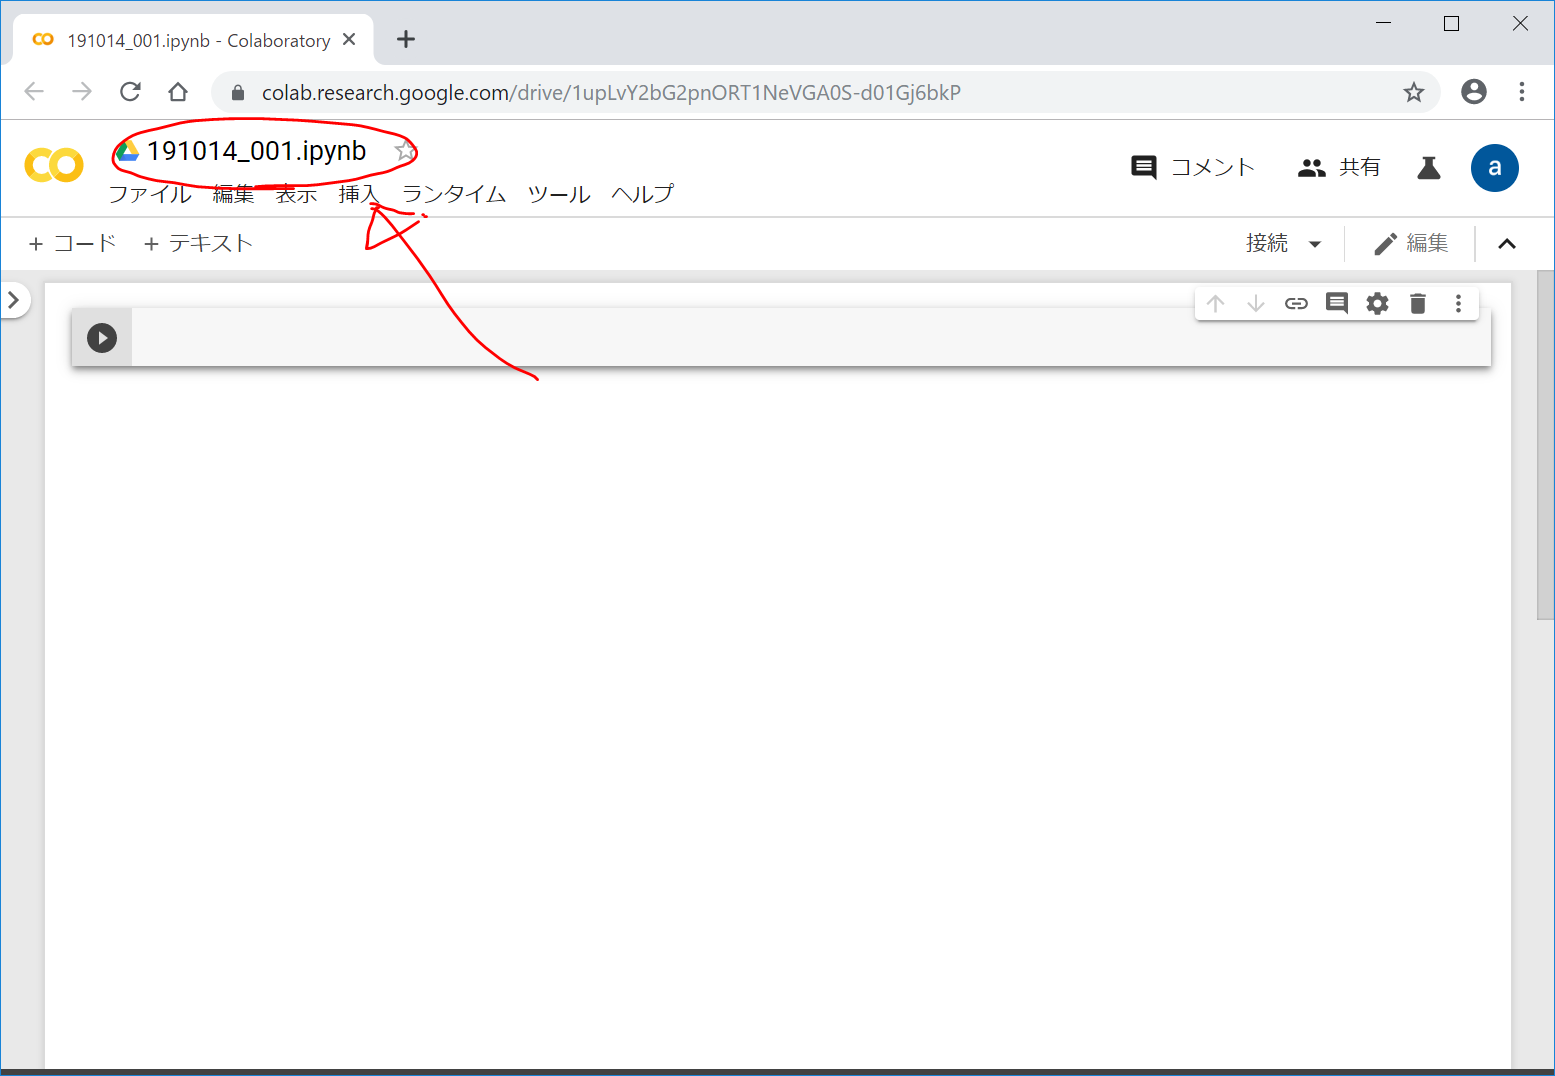
今回は、191014_001.ipynb という名前にしました。
自前データのアップロードとread_excel()によるエクセルデータのRへの取り込み
今回、Rに取り込みたい自前データbook2.xlsxを、デスクトップに保存しておくものとします。
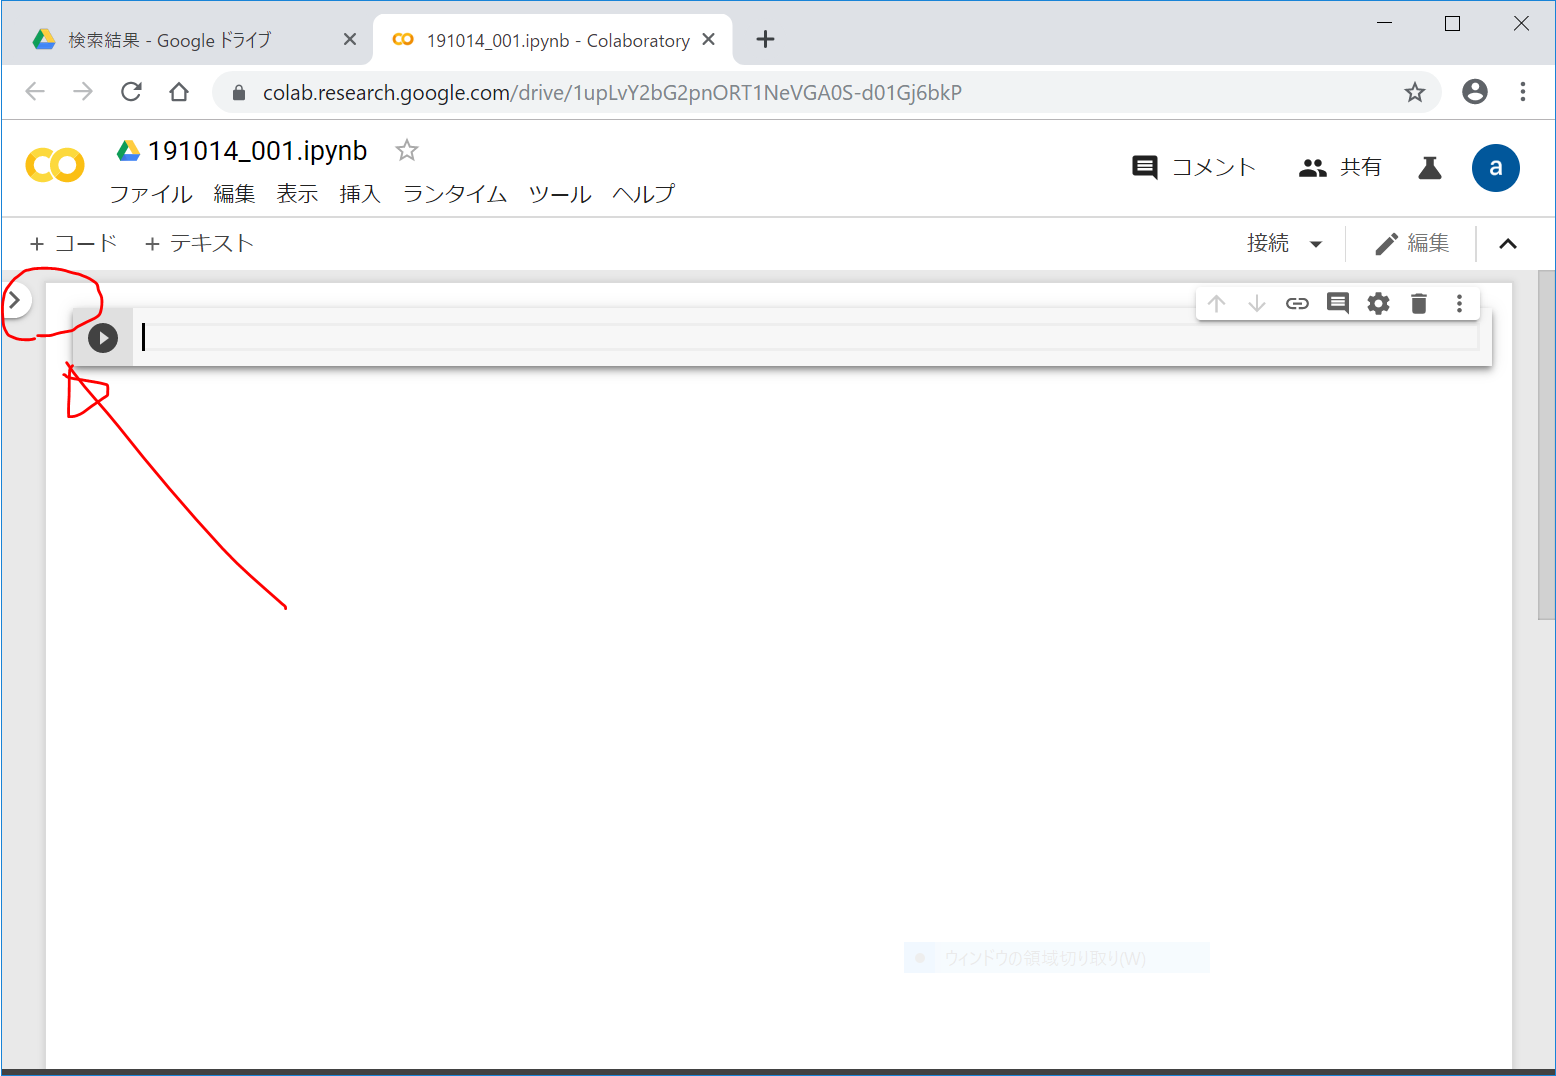
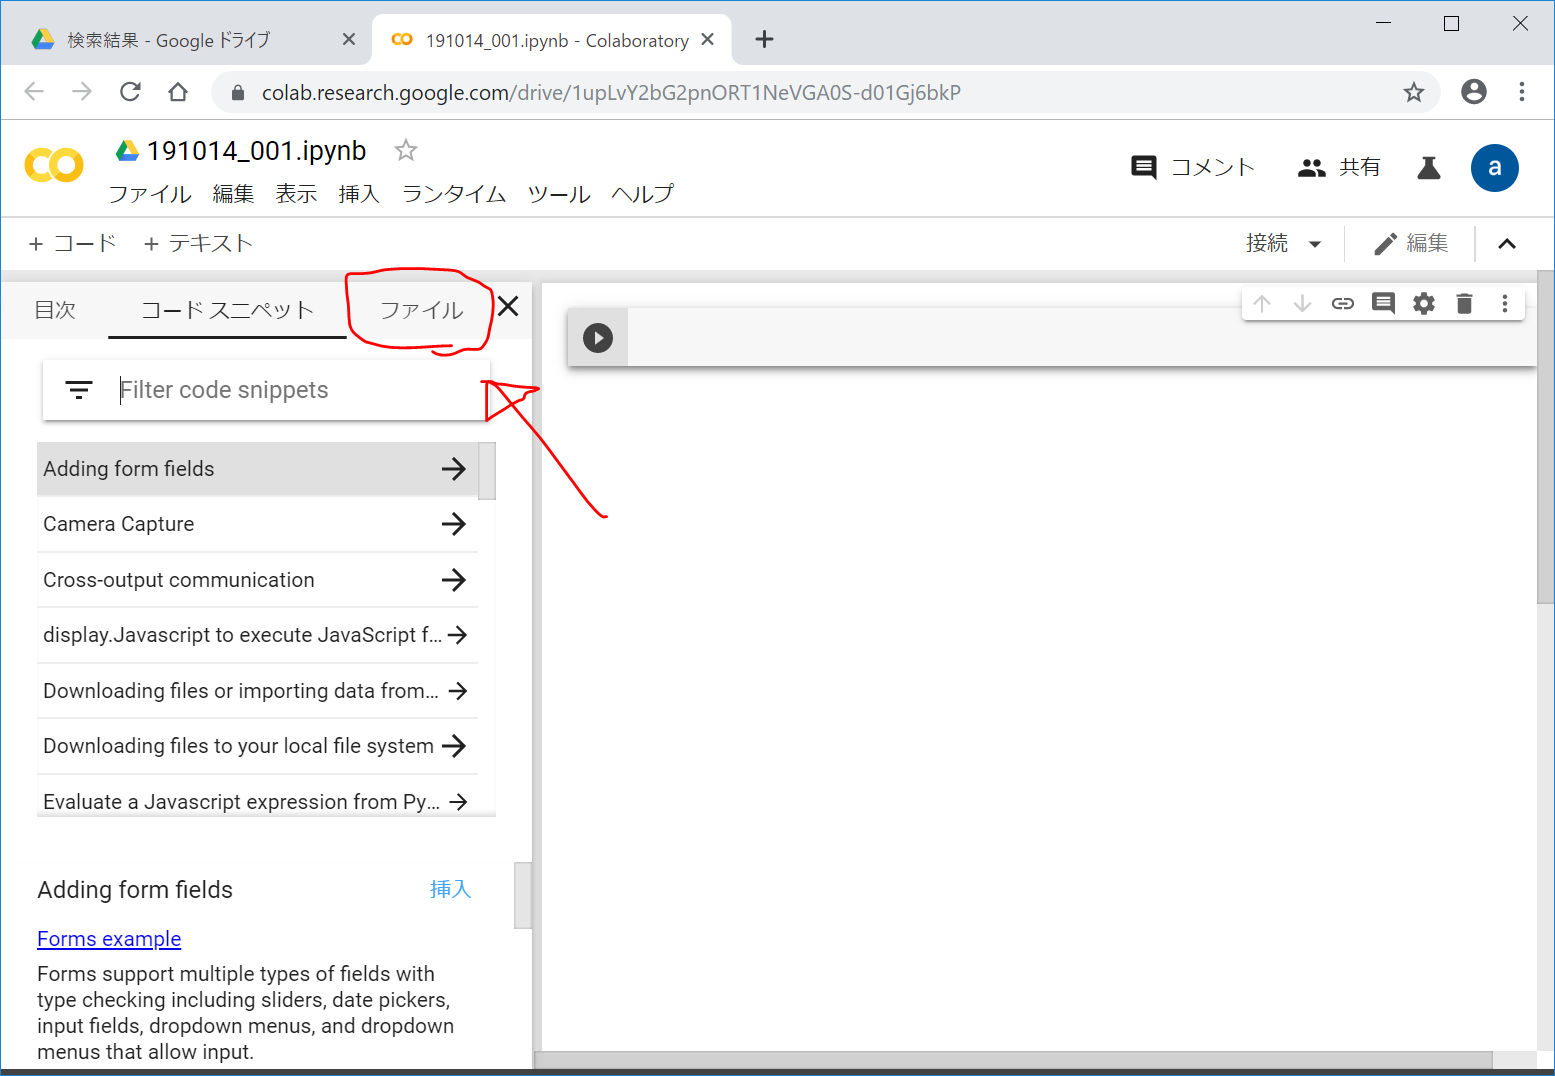
画面左上の『>』をクリックして、左側からタブのような画面を引き出します。
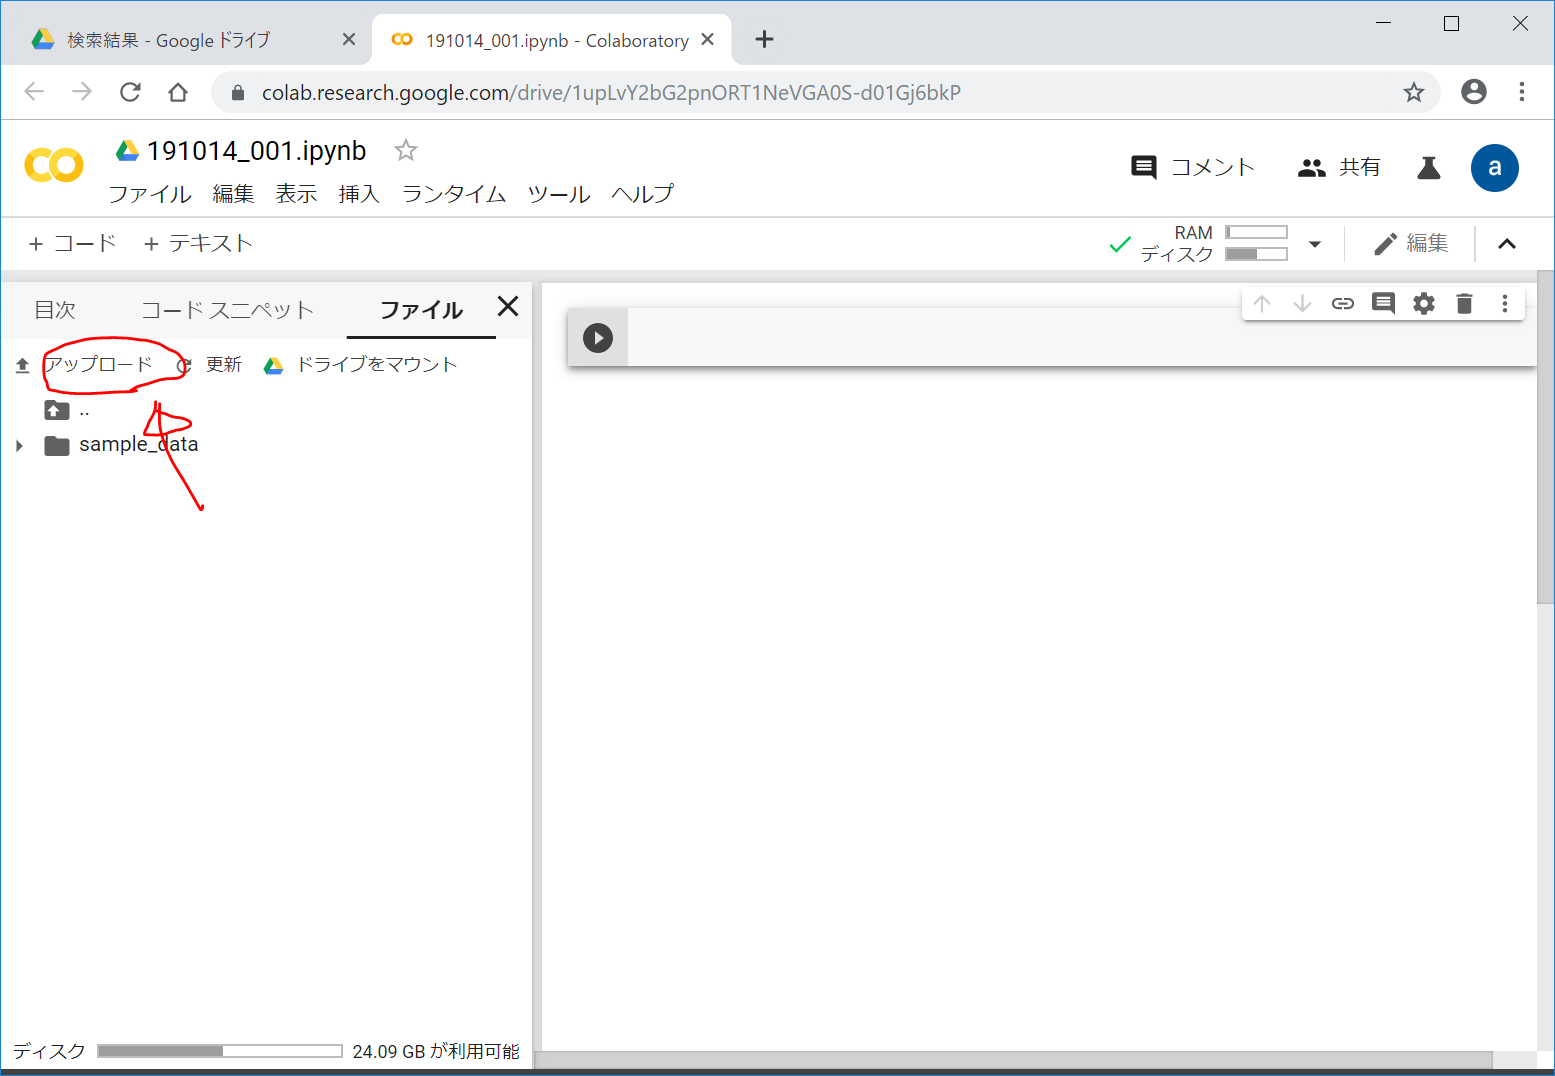
『ファイル』をクリック。
『アップロード』をクリック。
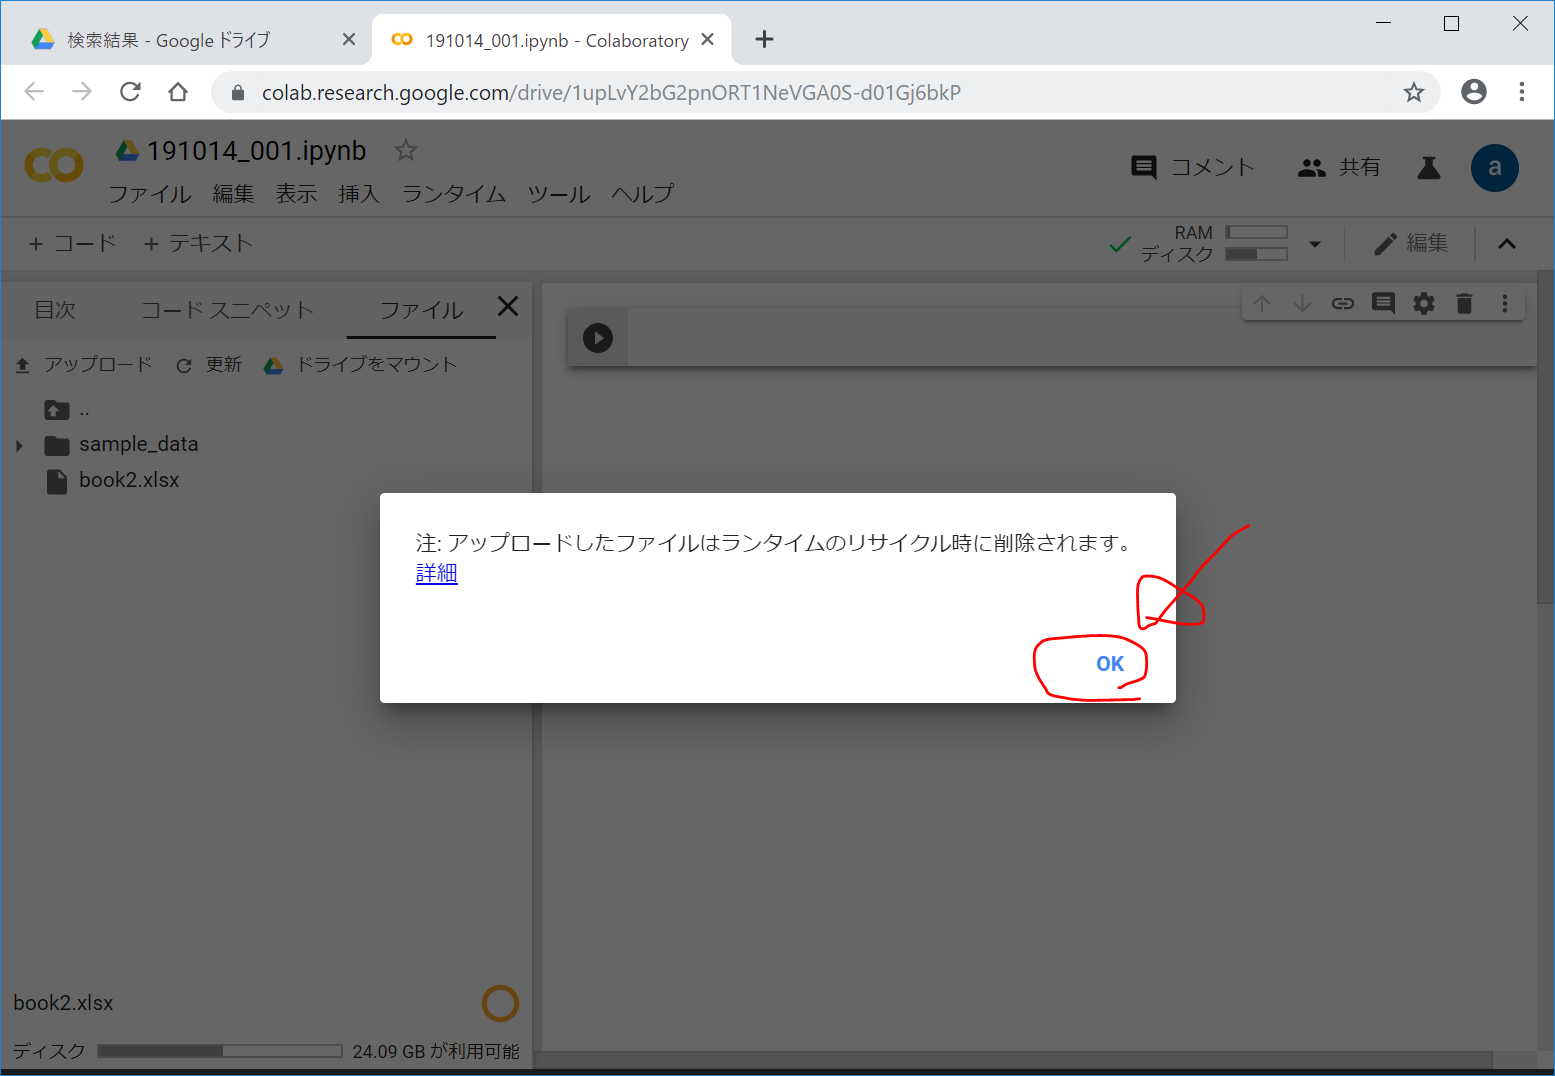
book2.xlsx を選択して、『開く』をクリック。
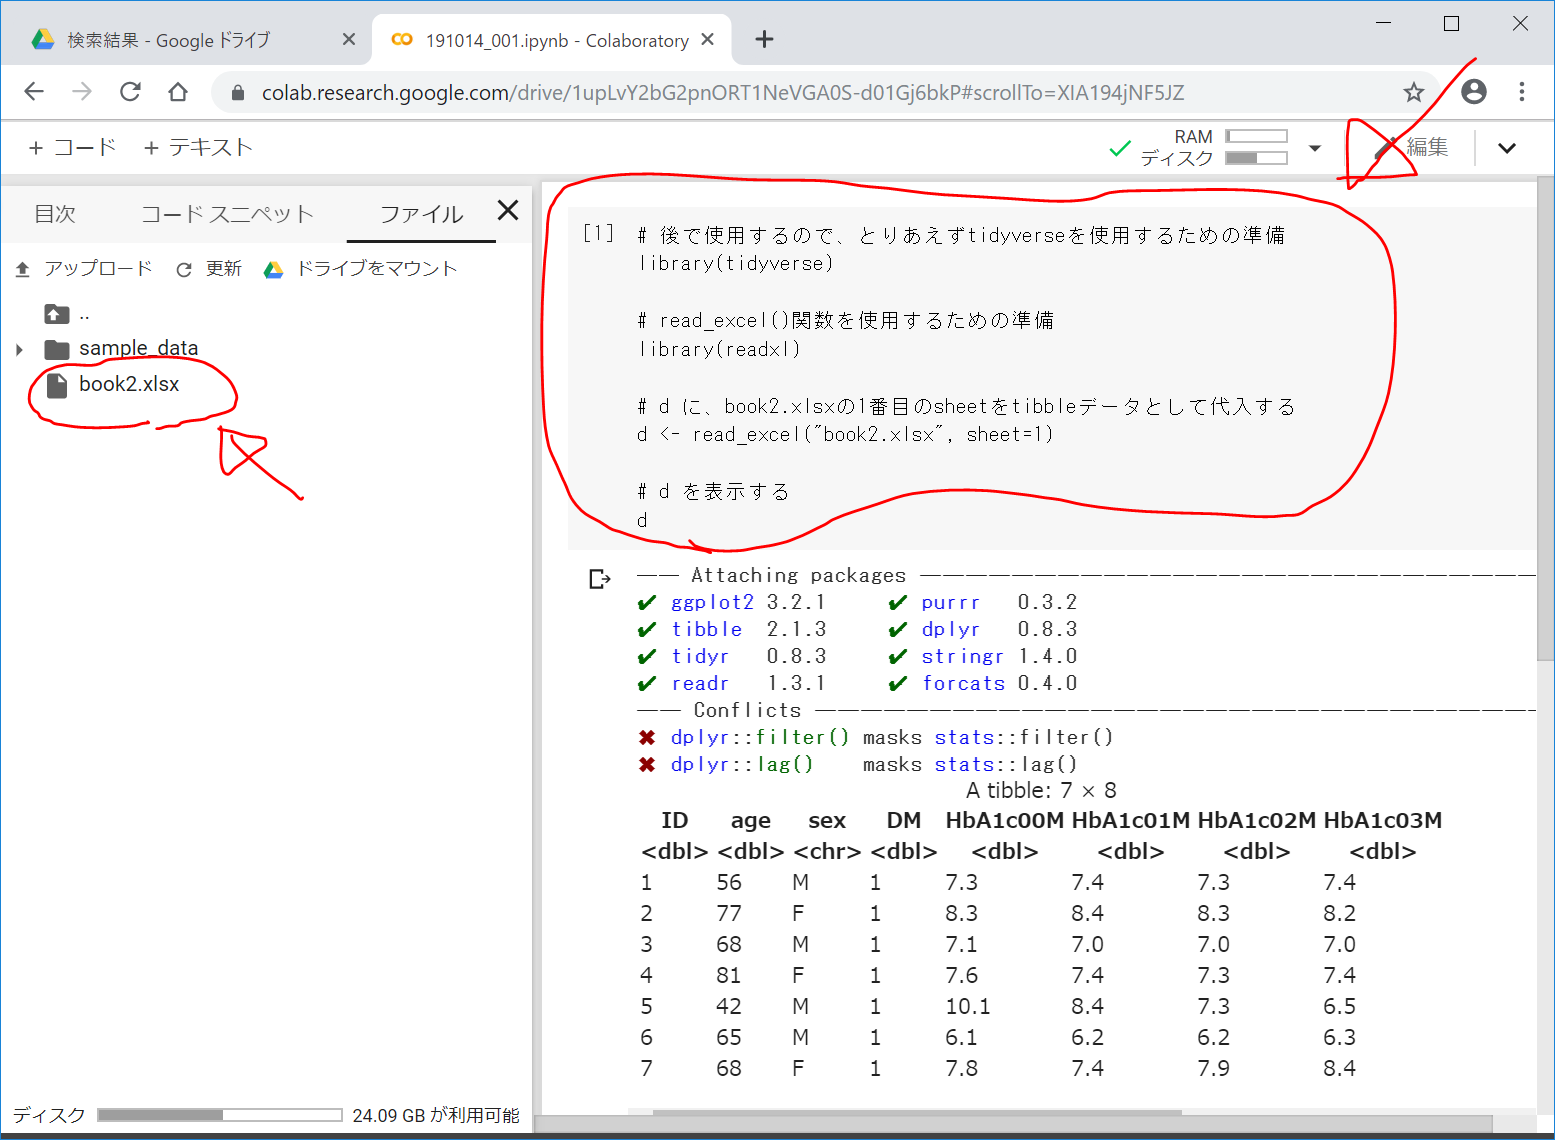
左側の画面に、book2.xlsxが表示されるので、右側のコードを入力する画面に以下を入力して、Shift+Enterを押して実行します。
# 後で使用するので、とりあえずtidyverseを使用するための準備
library(tidyverse)

# read_excel()関数を使用するための準備
library(readxl)

# d に、book2.xlsxの1番目のsheetをtibbleデータとして代入する
d <- read_excel("book2.xlsx", sheet=1)

# d を表示する
d
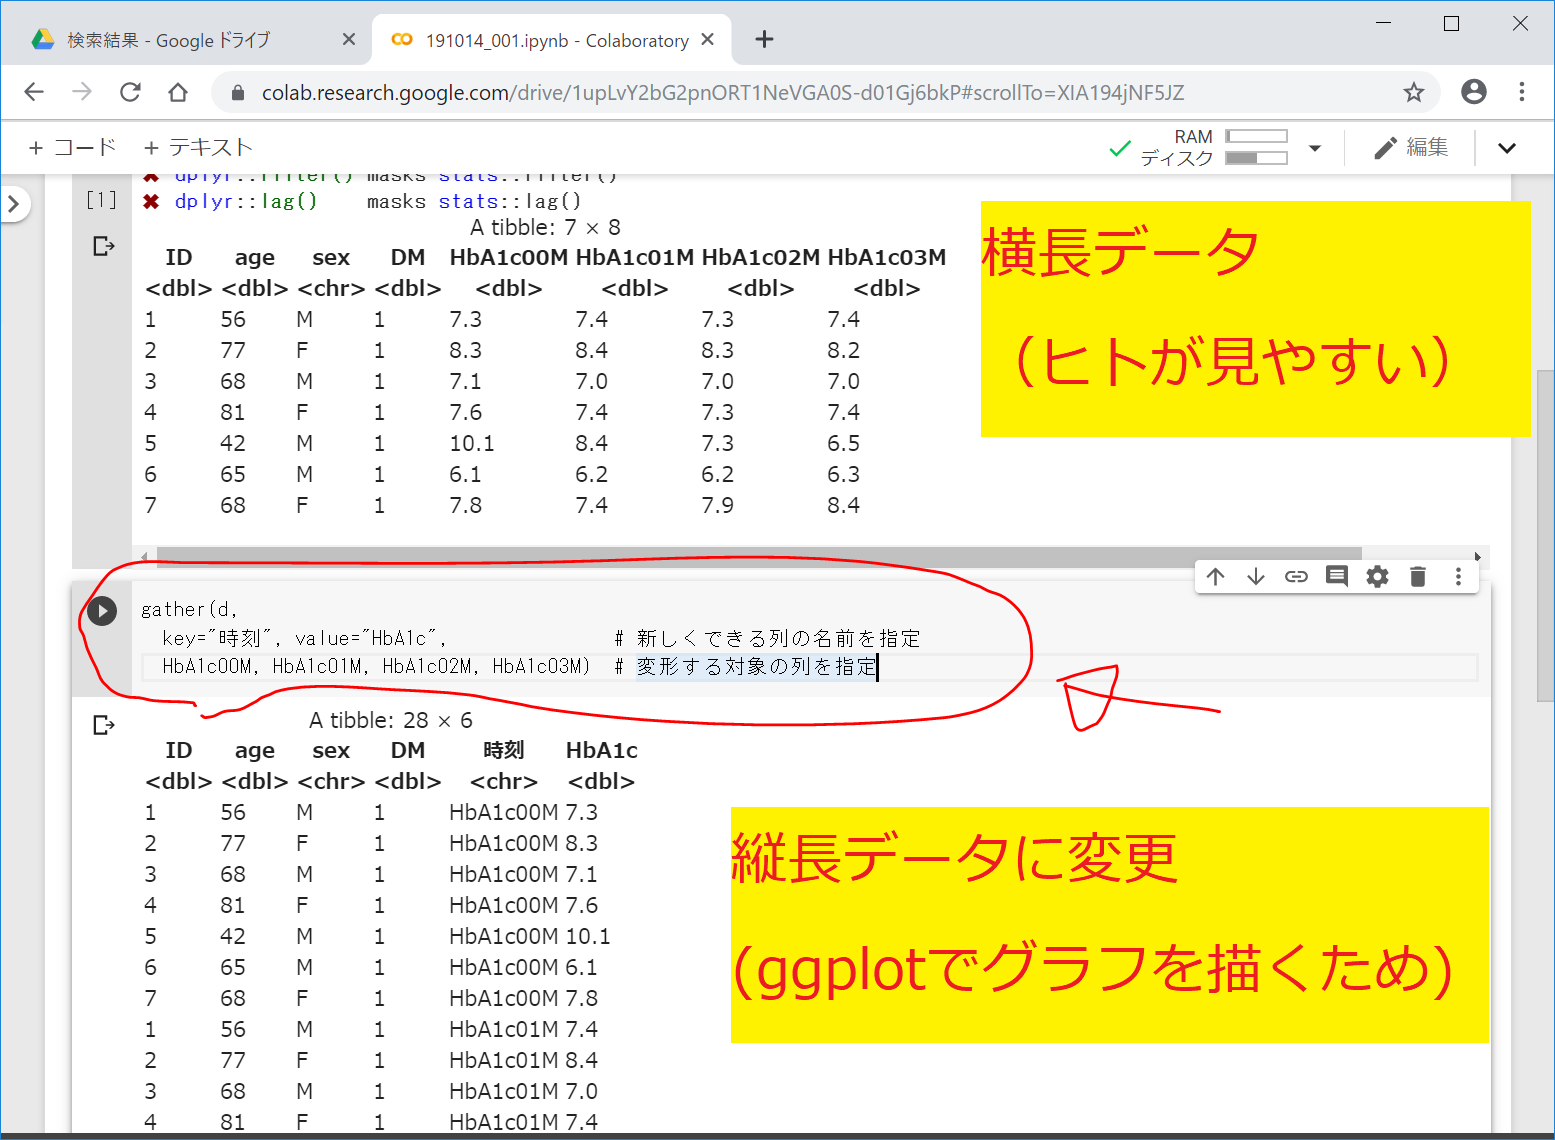
ggplotでグラフ描画するためにデータをtidy data(整然データ)に変換
いきなり出てきた“tidy data”ですが、RユーザのためのRStudio[実践]入門によりますと、『ベクトルの処理が得意なRで扱いやすい縦長のデータ形式』だそうです。具体的には、以下の3条件を満たすデータだそうです(By Hadley Wickham)。
- 1つの列が1つの変数を表す
- 1つの行が1つの観測を表す
- 1つのテーブルが1つのデータセットだけを含む
詳しくは、以下の本が非常にお勧めです。
理論は置いておいて、今回は、グラフを描くために、とりあえず、gather()関数を用いて、『d』を以下のように変形します。
tidy_d <- gather(d,
  key="time", value="HbA1c",               # 新しくできる列の名前を指定
  HbA1c00M, HbA1c01M, HbA1c02M,	HbA1c03M)  # 変形する対象の列を指定
tidy_d
gather()関数について
gather()関数の引数は、以下のようになっています。
gather(データ,
  key="キーの列の名前", value="値の列の名前",
  変形する対象の列1, 変形する対象の列2, ...)
2021年現在、pivot_longer()関数が推奨です。
https://qiita.com/yanami/items/3775df6c579fd0a2d60c
@yanami
が2020年09月15日に更新
【tidyr】gather?, spread? もう古い。時代はpivot
mutate()関数について
列を追加するときには、mutate()関数を用いるのが便利です。
参考:列の変換 - mutate関数
dplyr — 高速data.frame処理
dplyrを使いこなす!基礎編(@matsuou1, 2016年01月22日に更新)
group_by()関数とsummarise()関数を用いてグループごとに集計する
timeごとに、HbA1cの平均meanと標準偏差sdを求めます。以下のようにします。
tidy_d %>%
  group_by(time) %>%
  summarise(HbA1c_avg = mean(HbA1c), HbA1c_sd = sd(HbA1c))
参考
# entropyの平均と標準偏差
variety_ave <- tidy_d %>%
                group_by(type, time) %>%
                summarise(mass_ave = mean(Entropy, na.rm = TRUE))
variety_ave
group_by(type, time) で、type別に、time別に、group分けして平均を計算してくれます。
na.rm = TRUE で、NAを無視して計算してくれます。
https://stats.biopapyrus.jp/r/basic/nan.html
R の非数値(NA、NaN、Inf など)の取り扱い方
欠損値
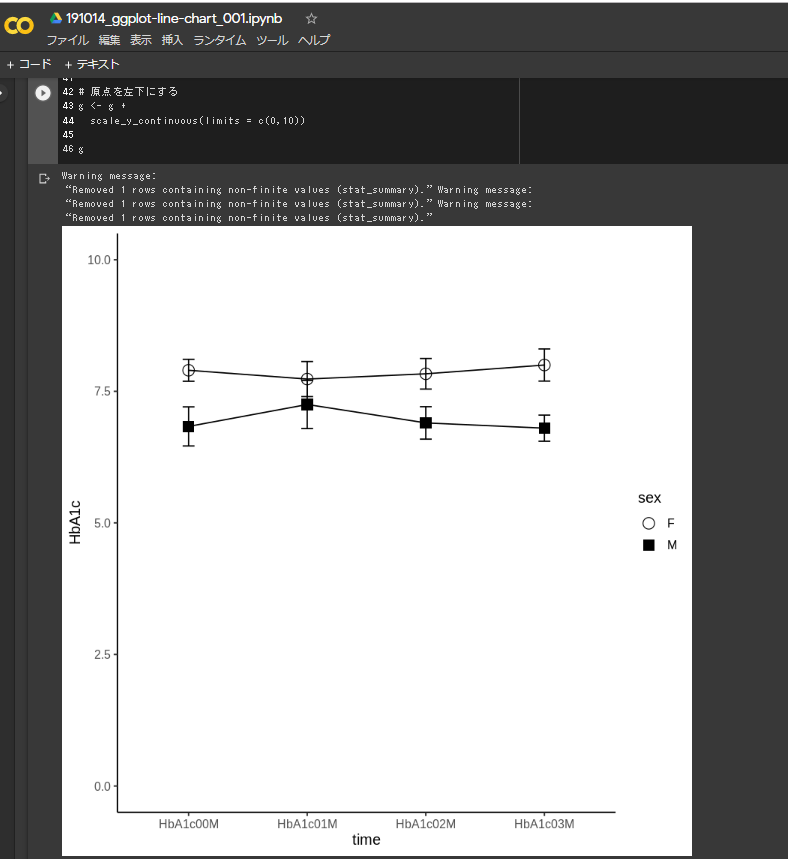
ggplot()関数とstat_summary()関数で折れ線グラフを描く
# ggplot()関数とstat_summary()関数で折れ線グラフを描く
g <- ggplot(data = tidy_d, aes(x = time, y=HbA1c)) +
  theme_set(theme_classic(base_size = 12)) +
  stat_summary(
    aes(group=sex),    # sex性別ごとに
    fun.y=mean,        # 平均値を
    geom="line",       # 線でつなげて
    colour="black",    # 色は黒で
    size=0.5          # 先の太さは0.5mm
  )

# エラーバーの追加
# Google Colaboratoryでは、fun.data = mean_sdl (標準偏差)はうまくいかない
# R Studioではうまくいくよう
g <- g +
  stat_summary(aes(group=sex),  # sex性別ごとに
    fun.data=mean_se,          # mean_seで標準誤差、#mean_cl_normalで95%信頼区間(正規分布)
    geom="errorbar",
    size=0.5,                   # 線の太さ
    width=0.1
  )

# エラーバーの上から重ねて、点(マーク)を描き入れる
g <-g +
  stat_summary(
    aes(shape=sex),   # 種類ごとに点の形を変えて
    fun.y=mean,        # 種類ごとの平均値のところに
    geom="point",      # 点で
    colour="black",
    size=4)

# 形の指定
# 点の形を1番◯、15番■(、23番◇)にマニュアル変更
g <- g +
  scale_shape_manual(values=c(1,15))

# 原点を左下にする
g <- g +
  scale_y_continuous(limits = c(0,10))

g
ggplot2に関するリンク
ggplot2は、tidyverseパッケージに含まれている、グラフを描画するための便利なパッケージです。
Rでグラフを描くなら、ggplot2を利用するのがお勧めです。
利用方法
# tidyverseパッケージのインストール
# tidyverseはGoogle Colaboratoryには、あらかじめ入っています。
# ご自身のパソコンでRStudioを用いる場合は、最初の一回だけ、
# tidyverseパッケージのインストールが必要です。
install.packages("tidyverse")

# ggplot()関数を用いてグラフを描くときには、あらかじめ、
# tidyverseパッケージを利用する宣言をしておく必要があります。
# tidyverseパッケージを利用するための宣言
library("tidyverse")
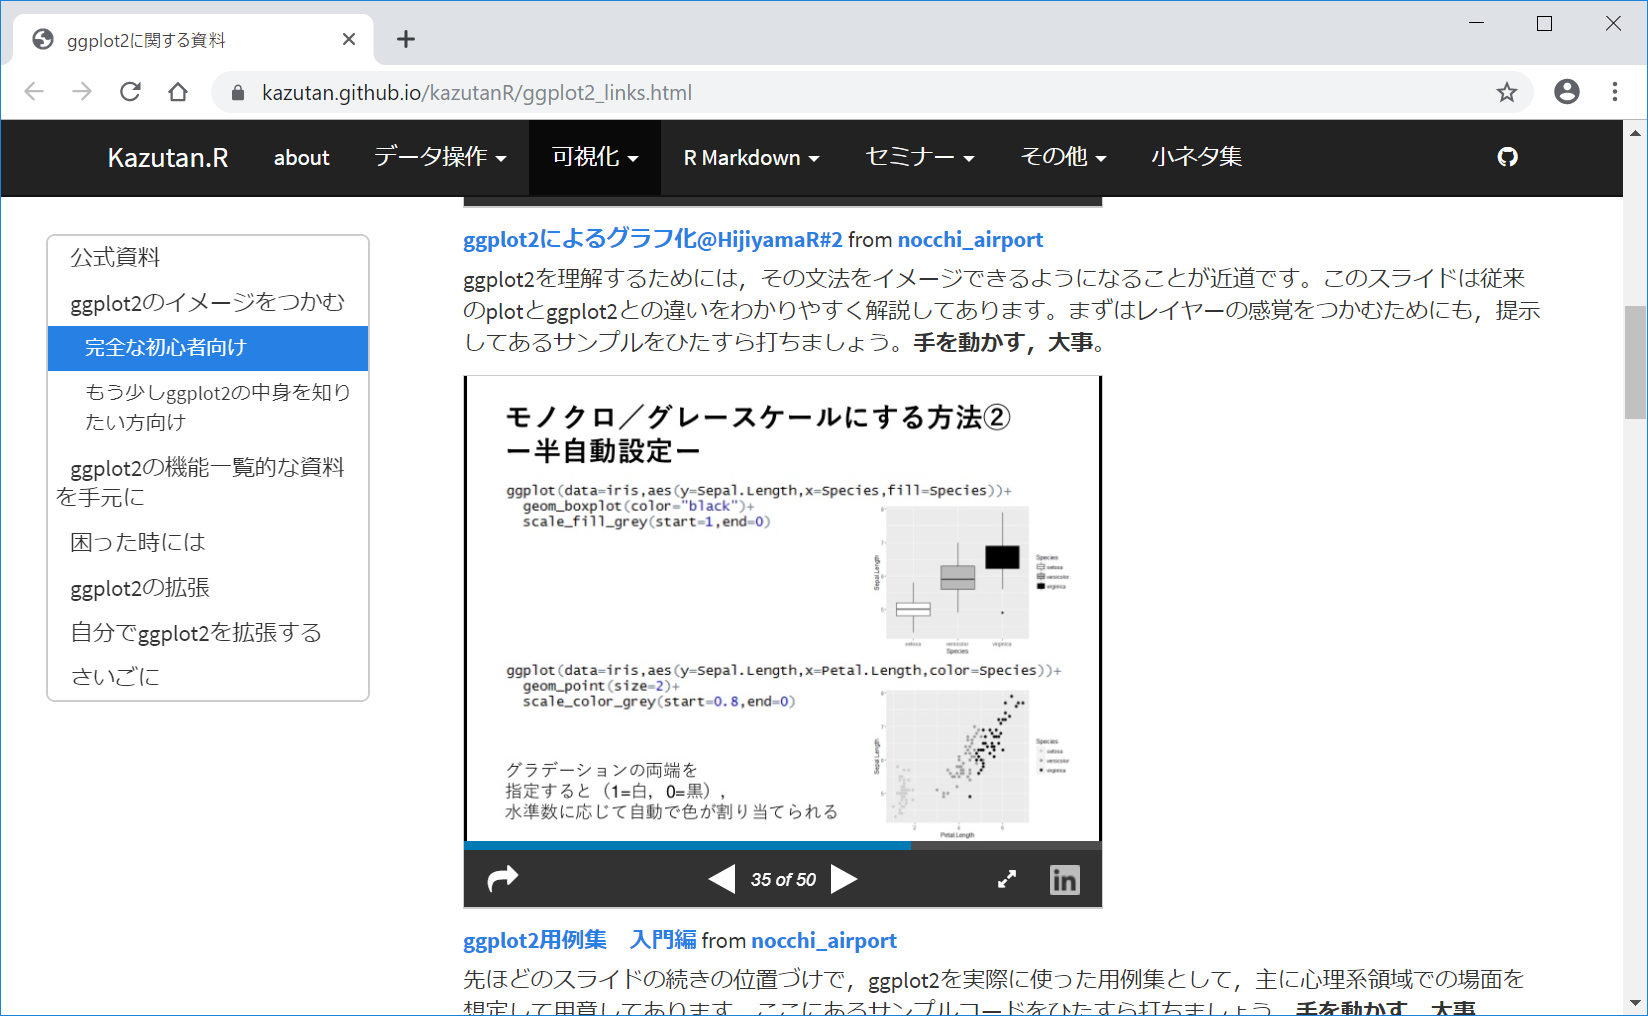
ggplot2に関して、最初に見るとよさそうなページ
https://kazutan.github.io/kazutanR/ggplot2_links.html
ggplot2に関する資料
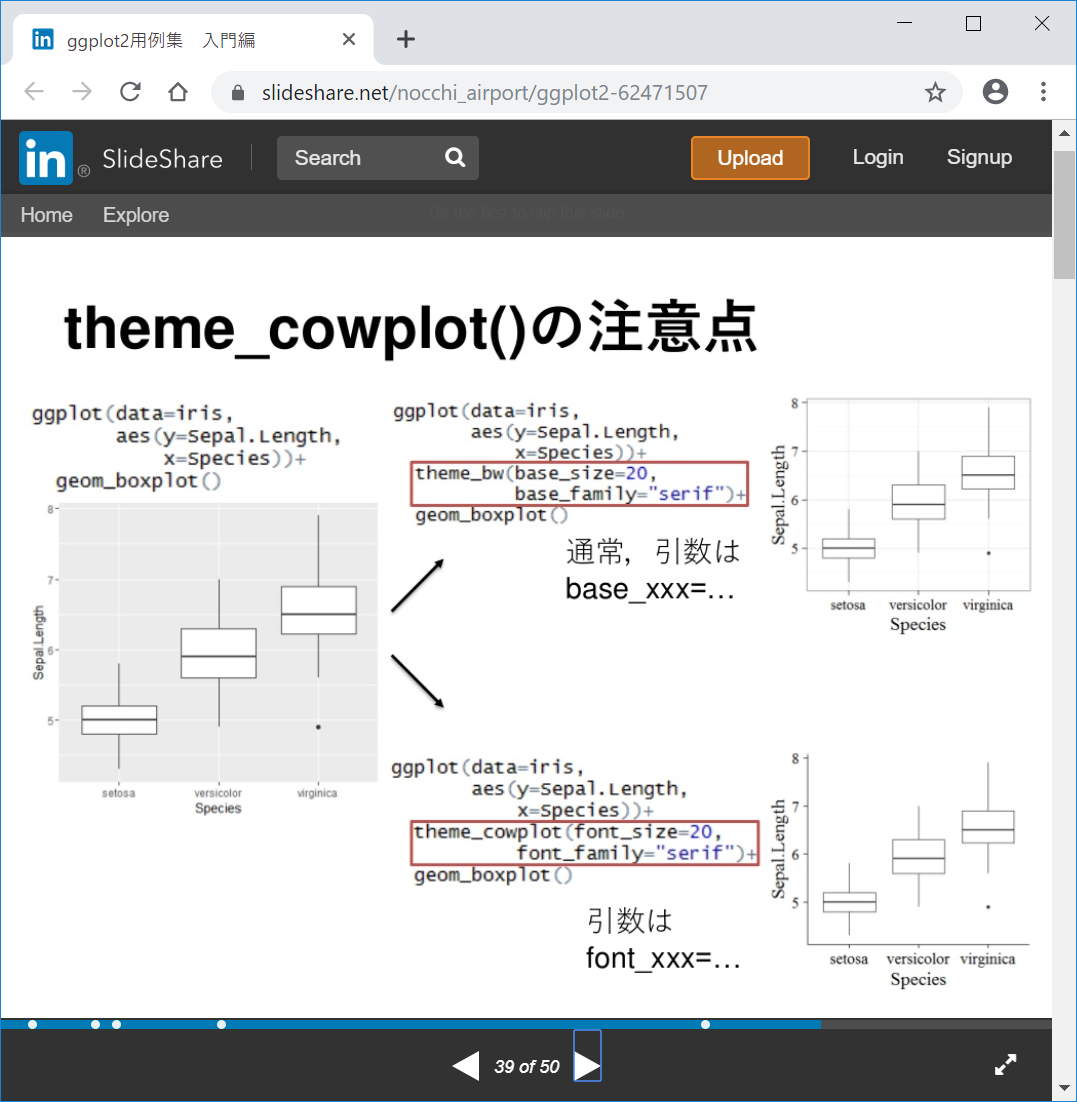
論文用のグラフが描きやすくなる、cowplotパッケージなるものがあるらしい。
https://www.slideshare.net/nocchi_airport/ggplot2-62471507

Rでggplot2で棒グラフのリンク
ソースコード
https://colab.research.google.com/drive/1hsdpM_FlUAIK8KzZJDUaUetrRnEons3U?hl=ja
geom_barと、stat_summeryを用いる方法がある
https://lpasteur.hatenablog.com/entry/2019/04/16/060000
20190424
ggplot2でお絵かき:プロット+平均値+標準偏差を示す
https://stats.biopapyrus.jp/r/ggplot/geom_bar.html
ggplot で棒グラフを描く方法
geom_bar
http://nsyk.sakura.ne.jp/homepage/2018/03/07/%e3%80%90ggplot%e3%83%a1%e3%83%a23%e3%80%91%e6%a3%92%e3%82%b0%e3%83%a9%e3%83%95%e3%82%92%e6%8f%8f%e3%81%8f/
【GGPLOTメモ3】棒グラフを描く
2018年3月7日
https://datator.exblog.jp/27008169/
ggplot2で棒グラフと散布図の組み合わせをつくってみる
2017-07-24 19:38
https://qiita.com/muraki_ng/items/a99e38cf265d44af5538
@muraki_ng
2018年09月26日に投稿
箱ひげ図に要約統計量を記載
https://stackoverflow.com/questions/41848271/ggplot2-stat-summary-mean-sdl-not-the-same-as-mean-sd
→ Use fun.args = list(mult = 1) as shown in the examples for stat_summary.
http://www.cs.uni.edu/~jacobson/4772/week3/errorBarChart.html
Error Bar Charts in R
https://code-examples.net/ja/q/125dc5c
棒グラフ stat_summary を使用した標準エラー バー
https://community.rstudio.com/t/adding-patterns-or-textures-to-geom-bar-geom-col-bars/4517/2
Adding patterns or textures to geom_bar() / geom_col() bars?
2018-01-26
stat_summary()関数について
Rで折れ線グラフのリンク
https://i-doctor.sakura.ne.jp/font/?p=21594
ggplot2で折れ線グラフ(2)
2017年12月12日
http://www.sthda.com/english/wiki/ggplot2-error-bars-quick-start-guide-r-software-and-data-visualization
ggplot2 error bars : Quick start guide - R software and data visualization
https://www.slideshare.net/nocchi_airport/ggplot2-62471507
ggplot2用例集 入門編
https://mrunadon.github.io/ThesisPlot/
論文用の棒グラフと折れ線グラフをggplot2で描く
https://mrunadon.github.io/ggplot2/
グラフ描画ggplot2の辞書的まとめ20のコード
https://www.atsumitakeshi.com/techs/R/R_ggplot2_GUI.html
ggplot2をGUIで操作する
2019.7.30
https://qiita.com/kilometer/items/c5d7833229a6916d9b6e
@kilometer
2018年06月20日に更新
折れ線のjitterは止めようという話
http://nsyk.sakura.ne.jp/homepage/2018/04/13/%E3%80%90ggplot%E3%83%A1%E3%83%A26%E3%80%91%E6%8A%98%E3%82%8C%E7%B7%9A%E3%82%B0%E3%83%A9%E3%83%95%E3%82%92%E6%8F%8F%E3%81%8F/
【GGPLOTメモ6】折れ線グラフを描く
2018年4月13日
(引用ここから)
# グラフの基本設定
ggplot() + theme_set( theme_classic(base_size = 12, base_family = "Hiragino Kaku Gothic Pro W3") )

# 描画
g <- ggplot( airquality, aes( x = Month, y = Temp ) ) +
  geom_line( stat = "summary", fun.y = "mean" ) +
  stat_summary(fun.y = "mean", geom = "point", shape = 21, size = 2., fill = "black") +
  stat_summary( fun.data = "mean_se", geom = "errorbar", width = .2) +
  xlab( "月" ) +
  ylab( "気温(華氏)" ) +
  scale_y_continuous( breaks = c( 32, 52, 72, 92 ), limits = c( 32, 95 ) )
g
(引用ここまで)
jitter
https://ggplot2.tidyverse.org/reference/geom_dotplot.html
Dot plot
本家サイト
https://www.karada-good.net/analyticsr/r-269
Rで解析:ジッタープロットの作成。「sinaplot」パッケージ
http://www.sthda.com/english/wiki/ggplot2-dot-plot-quick-start-guide-r-software-and-data-visualization
ggplot2 dot plot : Quick start guide - R software and data visualization
library(ggplot2)
# Basic dot plot
p<-ggplot(ToothGrowth, aes(x=dose, y=len)) +
  geom_dotplot(binaxis='y', stackdir='center')
p
エクセルの場合
https://bdastyle.net/tools/scatterplot/beeswarm-plot.html
Rのデータセットに関するリンク
https://qiita.com/wakuteka/items/95ac758070f6f4d89a96
@wakuteka
2016年12月26日に更新
R言語 標準データセットの私的まとめ
csvを取り込みたいときは、
library(tidyverse)

setwd(エクセルファイルのある場所)
data <- read_csv("data.csv")
#
エクセルを取り込みたいときは、
library(tidyverse)
library(readxl)

setwd(エクセルファイルのある場所)
data <- read_excel("data.xlsx", sheet = 1)
tribble()関数を用いる方法
library(tidyverse)

d <- tribble(
  ~id, ~age, ~sex, ~DM,	~HbA1c00M, ~HbA1c01M,	~HbA1c02M, ~HbA1c03M,
  1,	56,	"M",	1,	7.3,	7.4,	7.3,	7.4,
  2,	77,	"F",	1,	8.3,	8.4,	8.3,	8.2,
  3,	68,	"M",	1,	7.1,	7,	7,	7,
  4,	81,	"F",	1,	7.6,	7.4,	7.3,	7.4,
  5,	42,	"M",	1,	10.1,	8.4,	7.3,	6.5,
  6,	65,	"M",	1,	6.1,	6.2,	6.,	6.3,
  7,	68,	"F",	1,	7.8,	7.4,	7.9,	8.4,
)
d
ggplot2 memo
esquisseエスキスで描いてからコードをコピペする?
グラフ作成テンプレート
ggplot(data=<DATA>) +
  <GEOM_FUNCTION>(mapping = aes(<MAPPINGS>))
ggplot2グラフ作成の例
- キャンバスを用意する
- 棒グラフを描く
- エラーバーをつける
- 色をつけていく
- 表示範囲、軸のタイトルを設定
- 最終的な微調整
https://mrunadon.github.io/images/geom_kazutanR.html
ggplot2 まとめ: 初歩から程よいレベルまで
Mr.Unadon(うなどん)
2017/07/22
https://qiita.com/uri/items/892fc597a9076dec501e
@uri
2018年12月01日に更新
君の知らない物語(あまり知られていないtidyverseの便利な機能)
https://qiita.com/yuifu/items/83103d03aef2dba95465
@yuifu
2015年03月10日に投稿
ggplot2で論文用の図を作るときに使いたいオプション(点のshape、色、軸の文字の大きさ、色、エラーバー、背景)
https://qiita.com/kazutan/items/c42031ec54be283efd4f
@kazutan
2016年06月10日に更新
ggplot2に関する資料まとめ
エスキス
install.packages("esquisse")
# remotes::install_github("dreamRs/esquisse")

esquisse::esquisser(iris)

# Webブラウザで開きたい場合
esquisser(viewer = "browser")
エスキスの使い方(英語)
https://dreamrs.github.io/esquisse/articles/get-started.html
https://qiita.com/taro_9674/items/55dc92d30ba569465ca9
@taro_9674
2019年07月25日に投稿
【R言語】もうggplot2の操作も怖くない!esquisseパッケージの効力が絶大だった件
https://note.com/tqwst408/n/n82d56c69a18e
R言語:ggplotのGUIをまとめてみる
Osamu_Machida
2019/02/23 13:07
https://www.marketechlabo.com/r-best-packages/
Rのおすすめパッケージ2019年版
ソースコード
ソースコード1:191014_ggplot-line-chart_001.ipynb
https://colab.research.google.com/drive/1upLvY2bG2pnORT1NeVGA0S-d01Gj6bkP
https://adash333.github.io/ggplot2-example/191014_ggplot-line-chart_001.html
ソースコード2
https://colab.research.google.com/drive/1hsdpM_FlUAIK8KzZJDUaUetrRnEons3U?hl=ja
(Colaboratoryでは、なぜか、packageのインストールがうまくいかない。また、stat_summary関数の一部がうまく動かない)
https://adash333.github.io/ggplot2-example/191016_ggplot-bar.html
Rでグラフを描くためのお勧めの本
初めての方には、以下の本が非常にお勧めです。
上記の本でggplot2に慣れたら、以下の本でデータ整理について学んでみるのがお勧めです。
