ggplot2で折れ線グラフ(2)
前回の続き
http://twosquirrel.mints.ne.jp/?p=21579
今回は、以下のサイトを写経してみたい。
2015年 08月 20日
ggplot2を使ったグラフ作成(折れ線、時系列)
http://datator.exblog.jp/24805889/
(環境)
Windows 8.1 Pro
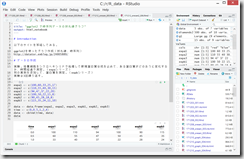
R Studio 1.1.383
(1)データの準備
以下、knit htmlして出てきたもの(表は画像をコピペ)をコピペ。
Contents
ggplot2 で時系列データの折れ線グラフ
Introduction
以下のサイトを写経してみる。
ggplot2を使ったグラフ作成(折れ線、時系列)
http://datator.exblog.jp/24805889/
データの作成
実験。培養細胞をシクロヘキシミドで処理して新規蛋白質合成を止めて、ある蛋白質がどのおうに変化するか、時間経過で測定。(expaシリーズ)
別の薬剤を添加して、蛋白質を測定。(expbシリーズ)
実験は3回繰り返す。
expa1 <- c(100,60,33,25,17)
expa2 <- c(110,55,40,30,15)
expa3 <- c(94,47,37,22,20)
expb1 <- c(100,50,22,15,8)
expb2 <- c(90,45,28,18,8)
expb3 <- c(115,35,24,11,10)

data <- data.frame(expa1, expa2, expa3, expb1, expb2, expb3)
time <- c(0,0.5,1,2,4)
data <- cbind(time, data)
data
それぞれの実験データを個々にプロット
ggplot2と、reshape2の利用
reshape2は、データフレームの再配置に便利なパッケージ
reshape2に含まれるmelt()関数を用いて、データを時間軸と実験ロットによって再配置。
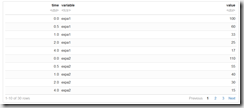
library(ggplot2)## Warning: package 'ggplot2' was built under R version 3.3.3library(reshape2)## Warning: package 'reshape2' was built under R version 3.3.3data_plot_individuals <- melt(data, id="time", measure = c("expa1","expa2","expa3","expb1","expb2","expb3"))
data_plot_individualsa <- ggplot(data_plot_individuals, aes(x = time, y = value, group = variable, colour = variable)) + geom_line()
aa <- a + theme(axis.title.x = element_text(size=20, family="Arial"),
axis.title.y = element_text(size=20, family="Araial"),
axis.text.x = element_text(size=20, colour=1, family="Arial"),
axis.text.y = element_text(size=20, colour=1, family="Arial"))
a <- a + labs(x="Time(hr)", y="Relative level(%)")
a## Warning in grid.Call(L_textBounds, as.graphicsAnnot(x$label), x$x, x$y, :
## Windows のフォントデータベースにフォントファミリが見付かりません
## Warning in grid.Call(L_textBounds, as.graphicsAnnot(x$label), x$x, x$y, :
## Windows のフォントデータベースにフォントファミリが見付かりません
## Warning in grid.Call(L_textBounds, as.graphicsAnnot(x$label), x$x, x$y, :
## Windows のフォントデータベースにフォントファミリが見付かりません
## Warning in grid.Call(L_textBounds, as.graphicsAnnot(x$label), x$x, x$y, :
## Windows のフォントデータベースにフォントファミリが見付かりません
## Warning in grid.Call(L_textBounds, as.graphicsAnnot(x$label), x$x, x$y, :
## Windows のフォントデータベースにフォントファミリが見付かりません## Warning in grid.Call.graphics(L_text, as.graphicsAnnot(x$label), x$x, x
## $y, : Windows のフォントデータベースにフォントファミリが見付かりません測定ポイントをドットで示すときは、geom_point()を用いる。
a <- a + geom_point(aes(colour=variable))
a
## Warning in grid.Call(L_textBounds, as.graphicsAnnot(x$label), x$x, x$y, :
## Windows のフォントデータベースにフォントファミリが見付かりません
## Warning in grid.Call(L_textBounds, as.graphicsAnnot(x$label), x$x, x$y, :
## Windows のフォントデータベースにフォントファミリが見付かりません
## Warning in grid.Call(L_textBounds, as.graphicsAnnot(x$label), x$x, x$y, :
## Windows のフォントデータベースにフォントファミリが見付かりません
## Warning in grid.Call(L_textBounds, as.graphicsAnnot(x$label), x$x, x$y, :
## Windows のフォントデータベースにフォントファミリが見付かりません
## Warning in grid.Call(L_textBounds, as.graphicsAnnot(x$label), x$x, x$y, :
## Windows のフォントデータベースにフォントファミリが見付かりません## Warning in grid.Call.graphics(L_text, as.graphicsAnnot(x$label), x$x, x
## $y, : Windows のフォントデータベースにフォントファミリが見付かりませんexpaとexpbの平均の折れ線グラフ
data_plot_individualsのvariableを、グループ2つ(expaとexpb)に分ける。
group <- rep(c("groupa","groupb"), each=15)
data_plot_group <- cbind(data_plot_individuals, group)

head(data_plot_group)
dplyrパッケージの利用
library(dplyr)## Warning: package 'dplyr' was built under R version 3.3.3##
## Attaching package: 'dplyr'## The following objects are masked from 'package:stats':
##
## filter, lag## The following objects are masked from 'package:base':
##
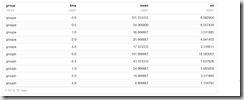
## intersect, setdiff, setequal, uniongroup_time_mean_sd <- data_plot_group %>% group_by(group, time) %>% summarize(mean = mean(value), sd=sd(value))
group_time_mean_sd
平均の折れ線グラフ
library(ggplot2)

b <- ggplot(group_time_mean_sd, aes(x=time, y=mean, group=group, colour=group)) + geom_line()
b <- b + theme(axis.title.x = element_text(size=20, family="Arial"),
               axis.title.y = element_text(size=20, family="Arial"),
               axis.text.x = element_text(size=20, colour=1, family="Arial"),
               axis.text.y = element_text(size=20, colour=1, family="Arial"))
b <- b + labs(x="Time(hr)", y="Relative leve(%)")
b
## Warning in grid.Call(L_textBounds, as.graphicsAnnot(x$label), x$x, x$y, :
## Windows のフォントデータベースにフォントファミリが見付かりません## Warning in grid.Call.graphics(L_text, as.graphicsAnnot(x$label), x$x, x
## $y, : Windows のフォントデータベースにフォントファミリが見付かりませんエラーバー
測定点にポイント図形も入れる。
errors <- aes(ymax = mean + sd, ymin = mean - sd)
b <- b + geom_errorbar(errors, width = 0.2) + geom_point(aes(colour=group, shape=group), size=4)
b
## Warning in grid.Call(L_textBounds, as.graphicsAnnot(x$label), x$x, x$y, :
## Windows のフォントデータベースにフォントファミリが見付かりません## Warning in grid.Call.graphics(L_text, as.graphicsAnnot(x$label), x$x, x
## $y, : Windows のフォントデータベースにフォントファミリが見付かりません縦軸を指定
Hide
b <- b + coord_cartesian(ylim = c(0,120)) + scale_y_continuous(breaks=seq(0,120,by=25), labels=c(0,25,50,75,100))Scale for 'y' is already present. Adding another scale for 'y', which will replace the
existing scale.Hide
b論文用グラフその1
縦軸横軸の線を入れて背景を白に、線はカラー
Hide
library(ggplot2)
c <- ggplot(group_time_mean_sd, aes(x=time, y=mean, group=group, colour=group)) + geom_line()
c <- c + labs(x="Time(hr)", y="Relative level(%)")
errors <- aes(ymax = mean + sd, ymin = mean - sd)
c <- c + geom_errorbar(errors, width=0.2) + geom_point(aes(colour=group, shape=group), size=4)
c <- c + theme_classic()
c
軸項目名などのスタイルを調整
Hide
library(ggplot2)
c <- ggplot(group_time_mean_sd, aes(x=time, y=mean, group=group, colour=group)) + geom_line()
c <- c + labs(x="Time(hr)", y="Relative level(%)")
errors <- aes(ymax = mean + sd, ymin = mean - sd)
c <- c + geom_errorbar(errors, width=0.2) + geom_point(aes(colour=group, shape=group), size=4)
c <- c + theme_classic()
c <- c + theme(axis.title.x = element_text(size=20, family="Arial"),
               axis.title.y = element_text(size=20, family="Arial"),
               axis.text.x = element_text(size=20, colour=1, family="Arial"),
               axis.text.y = element_text(size=20, colour=1, family="Arial"))
c <- c + coord_cartesian(ylim=c(0,120)) + scale_y_continuous(breaks=seq(0,120,by=25), labels=c(0,25,50,75,100))
c
横軸を0から開始。
今回は自動的に、x軸もy軸も0より少し小さい値から始まっている。
Hide
c <- c + coord_cartesian(ylim = c(0,120), xlim = c(0,4.2)) + scale_y_continuous(breaks = seq(0,120,by = 25), labels = c(0,25,50,75,100))Scale for 'y' is already present. Adding another scale for 'y', which will replace the
existing scale.Hide
c論文用体裁その2
Hide
library(ggplot2)
d <- ggplot(group_time_mean_sd,
            aes(x=time, y=mean, group=group)) +
  geom_line(aes(linetype=group))
d <- d + geom_point(aes(shape=group), size=4)
d <- d + theme_classic()
d <- d + theme(axis.title.x = element_text(size=20, family="Arial"),
               axis.title.y = element_text(size=20, family="Arial"),
               axis.text.x = element_text(size=20, family="Arial"),
               axis.text.y = element_text(size=20, family="Arial"))
d <- d + labs(x="Time(hr)", y="Relative level(%)")
errors <- aes(ymax = mean + sd, ymin = mean - sd)
d <- d + geom_errorbar(errors, width=0.2)
d <- d + coord_cartesian(ylim = c(0,120)) +
  scale_y_continuous(breaks = seq(0,120,by=25),labels=c(0,25,50,75,100))
d
やっと、なんか、それらしくなってきたかもしれない。
次は、以下のサイトを写経してみたい。


ディスカッション
コメント一覧
まだ、コメントがありません