00.初めての医療統計rとezr:20.rでラベルつき散布図
文書の過去の版を表示しています。
20.Rでラベルつき散布図
参考リンク
https://id.fnshr.info/2017/03/19/ggrepel/
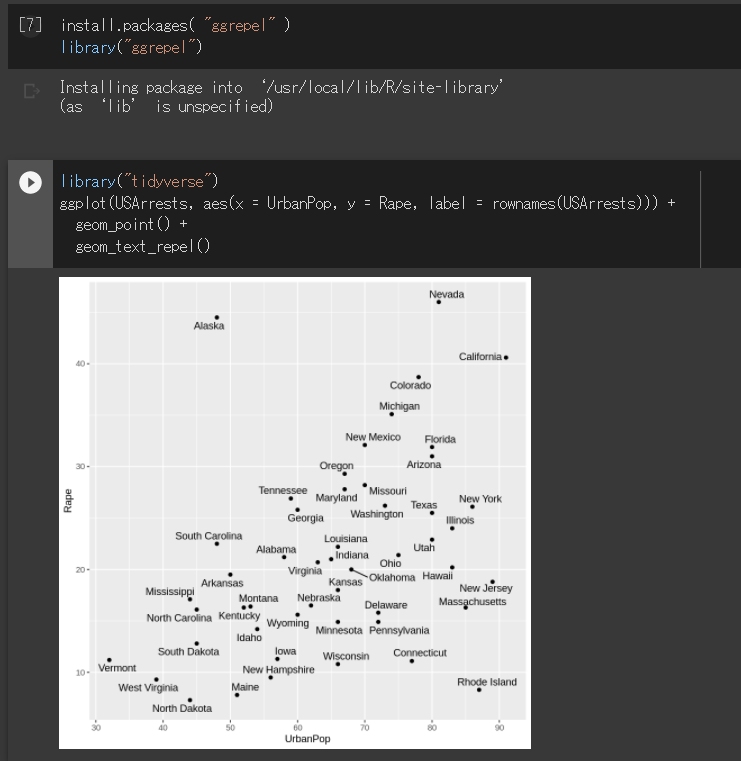
ggplot2 パッケージによる可視化の際のラベルの重なりを防ぐ
ggplot2(tidyverse)に加えて、
ggrepel パッケージを使う
install.packages( "ggrepel" )
library("ggrepel")

library(tidyverse)
ggplot(USArrests, aes(x = UrbanPop, y = Rape, label = rownames(USArrests))) +
  geom_point() +
  geom_text_repel()
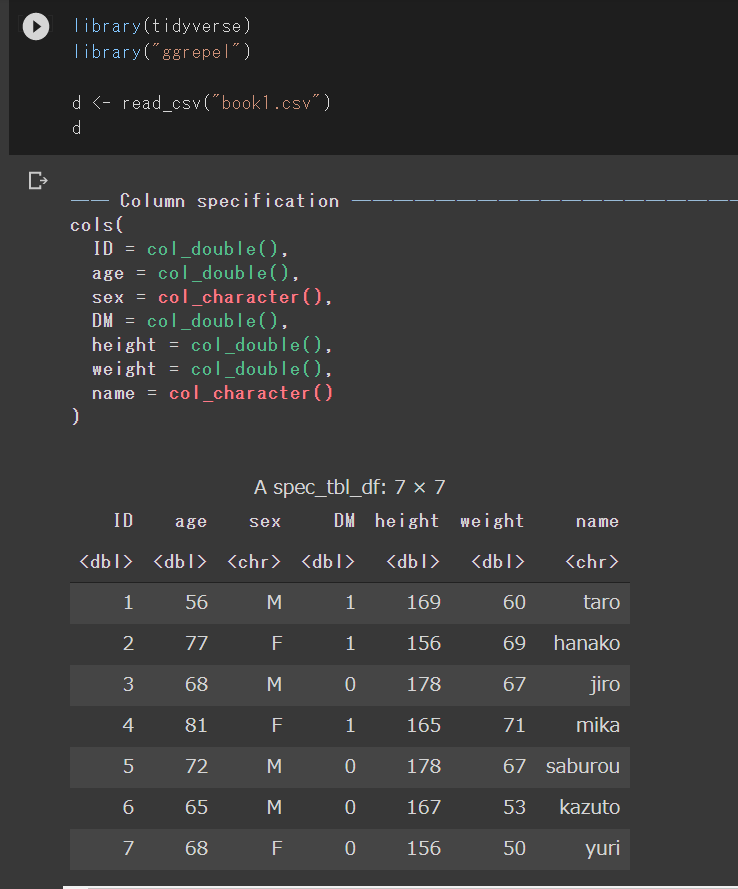
library(tidyverse)
library("ggrepel")

d <- read_csv("book1.csv")
d

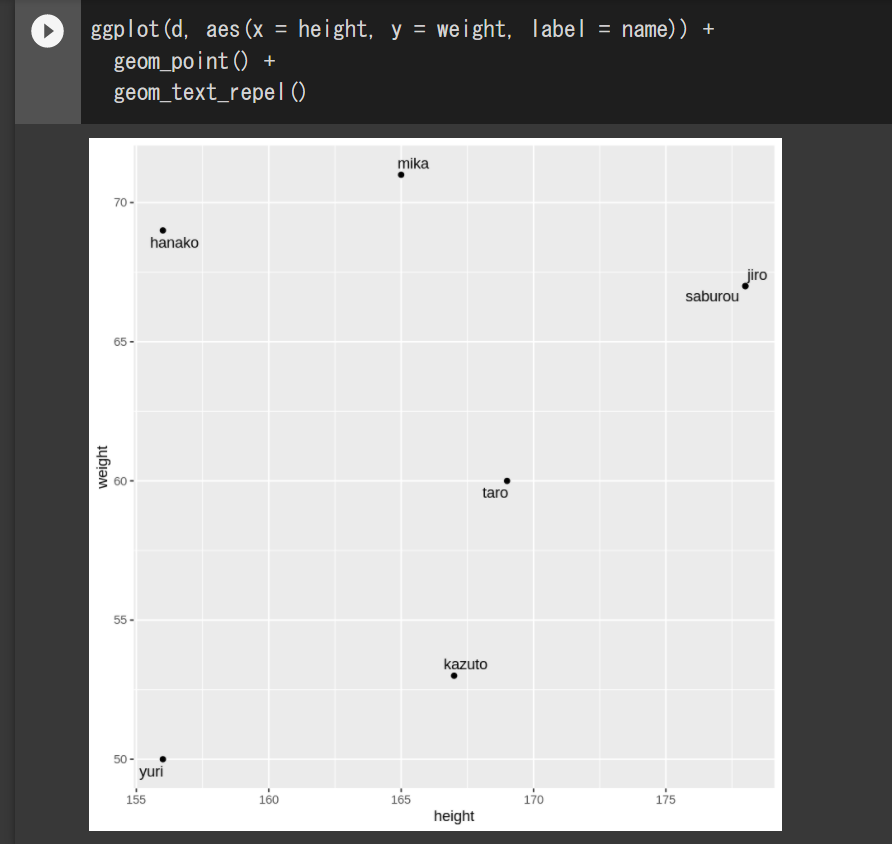
ggplot(d, aes(x = height, y = weight, label = name)) +
  geom_point() +
  geom_text_repel()
見出し
00.初めての医療統計rとezr/20.rでラベルつき散布図.1612955433.txt.gz · 最終更新: 2021/02/10 by adash333


